Linux--Valgrind工具内存泄露检测和性能分析
前言
内存泄露是我们在调试程序时经常遇到的问题,内存泄露分析软件也比较多,本文主要分析Valgrind工具的使用。
Valgrind的简介及安装
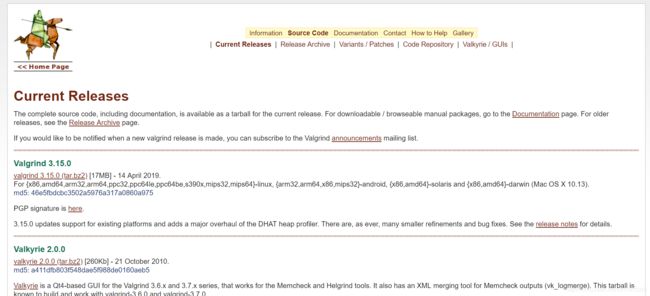
Valgrind官网下载: http://valgrind.org/downloads/current.html#current
目前最新版是valgrind 3.15.0 ,官网上面下载的很慢。可以直接从镜像源中安装该工具。如下:
sudo apt install valgrind
使用valgrind命令验证是否安装成功。
valgrind ls -l

Valgrind的使用
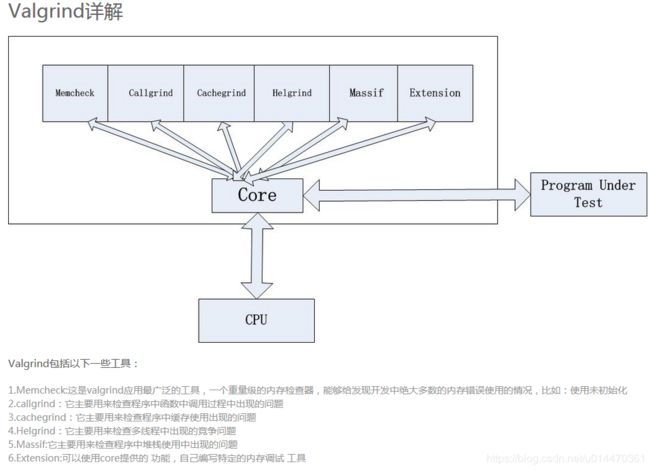
Valgrind工具包包含多个工具,如Memcheck,Cachegrind,Helgrind, Callgrind,Massif。
Memcheck
最常用的工具,用来检测程序中出现的内存问题,所有对内存的读写都会被检测到,一切对malloc()/free()/new/delete的调用都会被捕获。所以,Memcheck 工具主要检查下面的程序错误。
(1)使用未初始化的内存 Use of uninitialised memory
(2)使用已经释放了的内存 Reading/writing memory after it has been free’d
(3)使用超过 malloc分配的内存空间 Reading/writing off the end of malloc’d blocks
(4)对堆栈的非法访问 Reading/writing inappropriate areas on the stack
(5)申请的空间是否有释放 Memory leaks – where pointers to malloc’d blocks are lost forever
(6)malloc/free/new/delete申请和释放内存的匹配 Mismatched use of malloc/new/new [] vs free/delete/delete []
(7)src和dst的重叠 Overlapping src and dst pointers in memcpy() and related functions
这些问题往往是C/C++程序员最头疼的问题,Memcheck在这里帮上了大忙。
Callgrind
和gprof类似的分析工具,但它对程序的运行观察更是入微,能给我们提供更多的信息。和gprof不同,它不需要在编译源代码时附加特殊选项,但加上调试选项是推荐的。Callgrind收集程序运行时的一些数据,建立函数调用关系图,还可以有选择地进行cache模拟。在运行结束时,它会把分析数据写入一个文件。callgrind_annotate可以把这个文件的内容转化成可读的形式。
Cachegrind
Cache分析器,它模拟CPU中的一级缓存I1,Dl和二级缓存,能够精确地指出程序中cache的丢失和命中。如果需要,它还能够为我们提供cache丢失次数,内存引用次数,以及每行代码,每个函数,每个模块,整个程序产生的指令数。这对优化程序有很大的帮助。
Helgrind
它主要用来检查多线程程序中出现的竞争问题。Helgrind寻找内存中被多个线程访问,而又没有一贯加锁的区域,这些区域往往是线程之间失去同步的地方,而且会导致难以发掘的错误。Helgrind实现了名为“Eraser”的竞争检测算法,并做了进一步改进,减少了报告错误的次数。不过,Helgrind仍然处于实验阶段。
Massif
堆栈分析器,它能测量程序在堆栈中使用了多少内存,告诉我们堆块,堆管理块和栈的大小。Massif能帮助我们减少内存的使用,在带有虚拟内存的现代系统中,它还能够加速我们程序的运行,减少程序停留在交换区中的几率。
用法: valgrind [options] prog-and-args
[options]: 常用选项,适用于所有Valgrind工具
-tool= 最常用的选项。运行 valgrind中名为toolname的工具。默认memcheck。

    memcheck ------> 这是valgrind应用最广泛的工具,一个重量级的内存检查器,能够发现开发中绝大多数内存错误使用情况,比如:使用未初始化的内存,使用已经释放了的内存,内存访问越界等。

    callgrind ------> 它主要用来检查程序中函数调用过程中出现的问题。

    cachegrind ------> 它主要用来检查程序中缓存使用出现的问题。

    helgrind ------> 它主要用来检查多线程程序中出现的竞争问题。

    massif ------> 它主要用来检查程序中堆栈使用中出现的问题。

    extension ------> 可以利用core提供的功能,自己编写特定的内存调试工具

-h –help 显示帮助信息。
-version 显示valgrind内核的版本,每个工具都有各自的版本。
-q –quiet 安静地运行,只打印错误信息。
-v –verbose 更详细的信息, 增加错误数统计。
-trace-children=no|yes 跟踪子线程? [no]
-track-fds=no|yes 跟踪打开的文件描述?[no]
-time-stamp=no|yes 增加时间戳到LOG信息? [no]
-log-fd= 输出LOG到描述符文件 [2=stderr]
-log-file= 将输出的信息写入到filename.PID的文件里,PID是运行程序的进行ID
-log-file-exactly= 输出LOG信息到 file
-log-file-qualifier= 取得环境变量的值来做为输出信息的文件名。 [none]
-log-socket=ipaddr:port 输出LOG到socket ,ipaddr:port
实例测试
编写一个例子:
#include
#include
#include

void test()
{
        int *ptr = malloc( sizeof(int)* 10);
        ptr[10] =100;// 内存越界

        memcpy(ptr+1,ptr,5);//// 踩内存,内存的源地址和目的地址重叠

        free(ptr);
        free(ptr);// 重复释放

        int *p1;
        *p1 =10;// 非法指针


}

int main(int argc,char** argv)
{
        test();
        return 0;
}
gcc -g -o test -fno-inline test.c
–g -fno-inline 是编译选项保留调试信息, 否则后面的valgrind不能显示到出错行号直接运行。
直接运行./test

提示;double free or corruption,报了core dumped错误。
下面用valgrind工具分析。
valgrind --tool=memcheck --leak-check=full --show-reachable=yes --trace-children=yes ./test
–leak-check=full 指的是完全检查内存泄漏,
–show-reachable=yes是显示内存泄漏的地点,
–trace-children=yes是跟入子进程。
运行结果:
root@ubuntu:~# valgrind --tool=memcheck --leak-check=full --show-reachable=yes --trace-children=yes ./test
==43170== Memcheck, a memory error detector
==43170== Copyright (C) 2002-2015, and GNU GPL'd, by Julian Seward et al.
==43170== Using Valgrind-3.11.0 and LibVEX; rerun with -h for copyright info
==43170== Command: ./test
==43170==
==43170== Invalid write of size 4  // 无效写入,内存越界了
==43170==    at 0x4005F4: test (test.c:8)
==43170==    by 0x400653: main (test.c:23)
==43170==  Address 0x5204068 is 0 bytes after a block of size 40 alloc'd
==43170==    at 0x4C2DB8F: malloc (in /usr/lib/valgrind/vgpreload_memcheck-amd64-linux.so)
==43170==    by 0x4005E7: test (test.c:7)
==43170==    by 0x400653: main (test.c:23)
==43170==
==43170== Source and destination overlap in memcpy(0x5204044, 0x5204040, 5)// 内存地址重叠
==43170==    at 0x4C32513: memcpy@@GLIBC_2.14 (in /usr/lib/valgrind/vgpreload_memcheck-amd64-linux.so)
==43170==    by 0x400615: test (test.c:10)
==43170==    by 0x400653: main (test.c:23)
==43170==
==43170== Invalid free() / delete / delete[] / realloc()// 重复释放
==43170==    at 0x4C2EDEB: free (in /usr/lib/valgrind/vgpreload_memcheck-amd64-linux.so)
==43170==    by 0x40062D: test (test.c:13)
==43170==    by 0x400653: main (test.c:23)
==43170==  Address 0x5204040 is 0 bytes inside a block of size 40 free'd
==43170==    at 0x4C2EDEB: free (in /usr/lib/valgrind/vgpreload_memcheck-amd64-linux.so)
==43170==    by 0x400621: test (test.c:12)
==43170==    by 0x400653: main (test.c:23)
==43170==  Block was alloc'd at
==43170==    at 0x4C2DB8F: malloc (in /usr/lib/valgrind/vgpreload_memcheck-amd64-linux.so)
==43170==    by 0x4005E7: test (test.c:7)
==43170==    by 0x400653: main (test.c:23)
==43170==
==43170== Use of uninitialised value of size 8 // 使用了未初始化的指针,非法的指针
==43170==    at 0x400632: test (test.c:16)
==43170==    by 0x400653: main (test.c:23)
==43170==
==43170== Invalid write of size 4
==43170==    at 0x400632: test (test.c:16)
==43170==    by 0x400653: main (test.c:23)
==43170==  Address 0x0 is not stack'd, malloc'd or (recently) free'd
==43170==
==43170==
==43170== Process terminating with default action of signal 11 (SIGSEGV)//由于非法指针赋值导致的程序崩溃
==43170==  Access not within mapped region at address 0x0
==43170==    at 0x400632: test (test.c:16)
==43170==    by 0x400653: main (test.c:23)
==43170==  If you believe this happened as a result of a stack
==43170==  overflow in your program's main thread (unlikely but
==43170==  possible), you can try to increase the size of the
==43170==  main thread stack using the --main-stacksize= flag.
==43170==  The main thread stack size used in this run was 8388608.
==43170==
==43170== HEAP SUMMARY:
==43170==     in use at exit: 0 bytes in 0 blocks
==43170==   total heap usage: 1 allocs, 2 frees, 40 bytes allocated
==43170==
==43170== All heap blocks were freed -- no leaks are possible
==43170==
==43170== For counts of detected and suppressed errors, rerun with: -v
==43170== Use --track-origins=yes to see where uninitialised values come from
==43170== ERROR SUMMARY: 5 errors from 5 contexts (suppressed: 0 from 0) //一共5个错误
Segmentation fault (core dumped)
Callgrind使用:
和gprof类似的分析工具,但它对程序的运行观察更是入微,能给我们提供更多的信息。和gprof不同,它不需要在编译源代码时附加特殊选项,但加上调试选项是推荐的。Callgrind收集程序运行时的一些数据,建立函数调用关系图,还可以有选择地进行cache模拟。在运行结束时,它会把分析数据写入一个文件。callgrind_annotate可以把这个文件的内容转化成可读的形式。
cachegrind 使用实例:
#include
#include
void test()
{
    sleep(1);
}
void f()
{
    int i;
    for( i = 0; i < 5; i ++)
        test();
}
int main()
{
    f();
    printf("process is over!\n");
    return 0;
}
使用方法是:valgrind --tool=cachegrind ./test

Helgrind
它主要用来检查多线程程序中出现的竞争问题。Helgrind寻找内存中被多个线程访问,而又没有一贯加锁的区域,这些区域往往是线程之间失去同步的地方,而且会导致难以发掘的错误。Helgrind实现了名为“Eraser”的竞争检测算法,并做了进一步改进,减少了报告错误的次数。不过,Helgrind仍然处于实验阶段。
首先举一个竞态的例子吧:
#include
#include
#define NLOOP 50
int counter = 0; /* incremented by threads */
void *threadfn(void *);
int main(int argc, char **argv)
{
pthread_t tid1, tid2,tid3;
pthread_create(&tid1, NULL, &threadfn, NULL);
pthread_create(&tid2, NULL, &threadfn, NULL);
pthread_create(&tid3, NULL, &threadfn, NULL);


/* wait for both threads to terminate */
pthread_join(tid1, NULL);
pthread_join(tid2, NULL);
pthread_join(tid3, NULL);


return 0;
}
void threadfn(void vptr)
{
int i, val;
for (i = 0; i < NLOOP; i++) {
val = counter;
printf("%x: %d \n", (unsigned int)pthread_self(), val+1);
counter = val+1;
}
return NULL;
}
这段程序的竞态在30~32行,我们想要的效果是3个线程分别对全局变量累加50次,最后全局变量的值为150,由于这里没有加锁,很明显竞态使得程序不能达到我们的目标。我们来看Helgrind是如何帮我们检测到竞态的。先编译程序:gcc -o test thread.c -lpthread ,然后执行:valgrind --tool=helgrind ./test 输出结果如下:
49c0b70: 1
49c0b70: 2
4666 Thread #3 was created
4666 at 0x412E9D8: clone (clone.S:111)
4666 by 0x40494B5: pthread_create@@GLIBC_2.1 (createthread.c:256)
4666 by 0x4026E2D: pthread_create_WRK (hg_intercepts.c:257)
4666 by 0x4026F8B: pthread_create@ (hg_intercepts.c:288)
4666 by 0x8048524: main (in /home/yanghao/Desktop/testC/testmem/a.out)
4666
4666 Thread #2 was created
4666 at 0x412E9D8: clone (clone.S:111)
4666 by 0x40494B5: pthread_create@@GLIBC_2.1 (createthread.c:256)
4666 by 0x4026E2D: pthread_create_WRK (hg_intercepts.c:257)
4666 by 0x4026F8B: pthread_create@ (hg_intercepts.c:288)
4666 by 0x8048500: main (in /home/yanghao/Desktop/testC/testmem/a.out)
4666
4666 Possible data race during read of size 4 at 0x804a028 by thread #3
4666 at 0x804859C: threadfn (in /home/yanghao/Desktop/testC/testmem/a.out)
4666 by 0x4026F60: mythread_wrapper (hg_intercepts.c:221)
4666 by 0x4048E98: start_thread (pthread_create.c:304)
4666 by 0x412E9ED: clone (clone.S:130)
4666 This conflicts with a previous write of size 4 by thread #2
4666 at 0x80485CA: threadfn (in /home/yanghao/Desktop/testC/testmem/a.out)
4666 by 0x4026F60: mythread_wrapper (hg_intercepts.c:221)
4666 by 0x4048E98: start_thread (pthread_create.c:304)
4666 by 0x412E9ED: clone (clone.S:130)
4666
4666 Possible data race during write of size 4 at 0x804a028 by thread #2
4666 at 0x80485CA: threadfn (in /home/yanghao/Desktop/testC/testmem/a.out)
4666 by 0x4026F60: mythread_wrapper (hg_intercepts.c:221)
4666 by 0x4048E98: start_thread (pthread_create.c:304)
4666 by 0x412E9ED: clone (clone.S:130)
4666 This conflicts with a previous read of size 4 by thread #3
4666 at 0x804859C: threadfn (in /home/yanghao/Desktop/testC/testmem/a.out)
4666 by 0x4026F60: mythread_wrapper (hg_intercepts.c:221)
4666 by 0x4048E98: start_thread (pthread_create.c:304)
4666 by 0x412E9ED: clone (clone.S:130)
4666
49c0b70: 3
…
55c1b70: 51
4666
4666 For counts of detected and suppressed errors, rerun with: -v
4666 Use --history-level=approx or =none to gain increased speed, at
4666 the cost of reduced accuracy of conflicting-access information
4666 ERROR SUMMARY: 8 errors from 2 contexts (suppressed: 99 from 31)
helgrind成功的找到了竞态的所在位置,加粗的位置所示。
Massif
堆栈分析器,它能测量程序在堆栈中使用了多少内存,告诉我们堆块,堆管理块和栈的大小。Massif能帮助我们减少内存的使用,在带有虚拟内存的现代系统中,它还能够加速我们程序的运行,减少程序停留在交换区中的几率。
Massif对内存的分配和释放做profile。程序开发者通过它可以深入了解程序的内存使用行为,从而对内存使用进行优化。这个功能对C++尤其有用,因为C++有很多隐藏的内存分配和释放。
此外,lackey和nulgrind也会提供。Lackey是小型工具,很少用到;Nulgrind只是为开发者展示如何创建一个工具。我们就不做介绍了。
内存检测原理

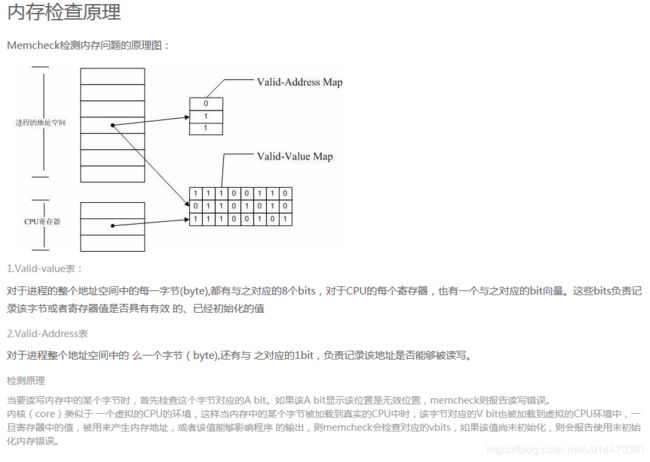
引自:https://www.cnblogs.com/AndyStudy/p/6409287.html
https://www.linuxidc.com/Linux/2012-06/63754.htm