信用卡交易异常检测是如何进行工作的?
这是星期天的早晨,很安静,你的脸上大笑起来。今天将会是美好的一天!除了你的电话响了,而且是“国际来电”。你慢慢拿起来,听到一些很奇怪的东西— “Bonjour, je suis Michele. Oops, sorry. I am Michele, your personal bank agent.”瑞士的某个人可能在这个时候给你打电话吗?“您是否授权一笔$ 3,358.65美元的交易,用于购买100份暗黑破坏神3?”马上,你就会想办法解释你为什么那样对待你所爱的人。
根据尼尔森报告,2015年全球欺诈损失达到$218亿美元。如果你是骗子,你可能感觉很幸运。
大约每100美元就有12美分同一年在美国失窃。我们的朋友米歇尔可能会在这里解决一个严重的问题。
在本系列的这一部分中,我们将以无监督(或半监督)方式训练自动编码器神经网络(在Keras中实施),用于信用卡交易数据中的异常检测。经过训练的模型将对预先标记和匿名数据集进行评估。
源代码和预测模型可在GitHub上找到。
设置
我们将使用TensorFlow1.2和Keras2.0.4。让我们开始:
注:译者使用的是Python3的TensorFlow1.2.1和Keras2.0.5版本,并顺利执行代码。
# 导入相关库
import pandas as pd
import numpy as np
import pickle
import matplotlib.pyplot as plt
from scipy import stats
import tensorflow as tf
import seaborn as sns
from pylab import rcParams
from sklearn.model_selection import train_test_split
from keras.models import Model, load_model
from keras.layers import Input, Dense
from keras.callbacks import ModelCheckpoint, TensorBoard
from keras import regularizers

%matplotlib inline

sns.set(style='whitegrid', palette='muted', font_scale=1.5)  # 配置seaborn库参数

rcParams['figure.figsize'] = 14, 8  # 设置画布大小

RANDOM_SEED = 42  # 定义随机种子
LABELS = ["Normal", "Fraud"]  # 定义标签,全局变量使用大写
加载数据
我们将要使用的数据集可从Kaggle下载。它包含两天内发生的信用卡交易数据,284,807笔交易中有492笔欺诈。
数据集中的所有变量都是数值。由于隐私原因,数据已经使用PCA进行了转换。没有改变的两个特征是时间和金额。时间包含数据集中每个交易和第一个交易之间经过的秒数。
df = pd.read_csv("data/creditcard.csv") # 读取数据集
探索
df.shape # 查看数据形状
> (284807, 31)
31列,其中2列是时间和金额。其余的是从PCA转换输出的。让我们检查缺失值:
df.isnull().values.any() # 检查是否有缺失值
> False
count_classes = pd.value_counts(df['Class'], sort = True)  # 计算分类数量并排序
count_classes.plot(kind = 'bar', rot=0)  # 绘制柱状图
plt.title("Transaction class distribution")  # 添加标题
plt.xticks(range(2), LABELS)  # 设置横坐标轴标签
plt.xlabel("Class")  # 设置x轴标题
plt.ylabel("Frequency")  # 设置y轴标题
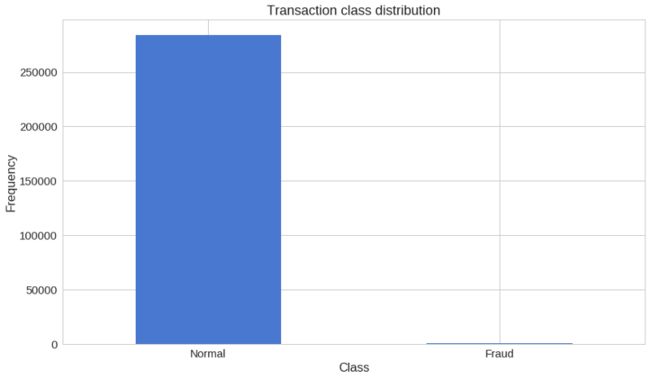
我们手上有非常不平衡的数据集。正常交易大大压倒了欺诈交易。我们来看两种交易类型:
frauds = df[df.Class == 1]  # 筛选出欺诈数据,即class特征为1的值
normal = df[df.Class == 0]  # 筛选出正常数据,即class特征为0的值

frauds.shape  # 查看欺诈数据形状
> (492, 31)
normal.shape # 查看正常数据形状
> (284315, 31)
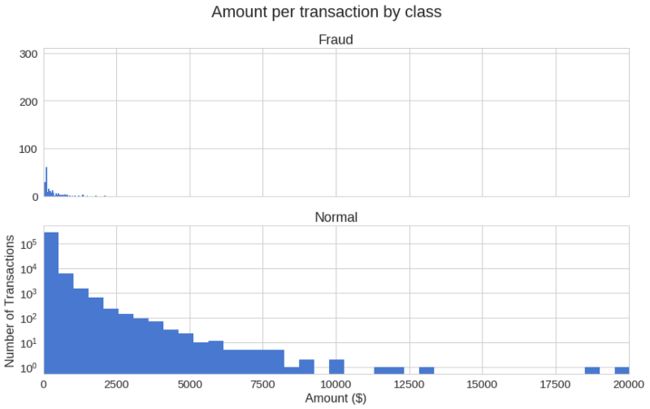
不同交易类别中使用的金额有多大不同?
frauds.Amount.describe() # 查看欺诈数据中金额的描述统计结果
normal.Amount.describe() # 查看正常数据中金额的描述统计结果
让我们用更多的图形去表示:
f, (ax1, ax2) = plt.subplots(2, 1, sharex=True)  # 绘制两行一列画布
f.suptitle('Amount per transaction by class')  # 添加画布标题

bins = 50  # 定义分箱数

ax1.hist(frauds.Amount, bins = bins)  # 添加欺诈数据金额的直方图到第一个图表上
ax1.set_title('Fraud')  # 设置标题

ax2.hist(normal.Amount, bins = bins)  # 添加正常数据金额的直方图到第二个图表上
ax2.set_title('Normal')  # 设置标题

plt.xlabel('Amount ($)')  # 设置x轴标签
plt.ylabel('Number of Transactions')  # 设置y轴标签
plt.xlim((0, 20000))  # 设置x轴界限
plt.yscale('log')  # y轴使用对数标尺
plt.show()  # 显示图表
欺诈交易在某些时间更频繁发生吗?
f, (ax1, ax2) = plt.subplots(2, 1, sharex=True)  # 绘制画布
f.suptitle('Time of transaction vs Amount by class')  # 添加画布标题

ax1.scatter(frauds.Time, frauds.Amount)  # 绘制诈欺数据时间与金额的散点图
ax1.set_title('Fraud')  # 设置标题

ax2.scatter(normal.Time, normal.Amount)  # 绘制正常数据时间与金钱的散点图
ax2.set_title('Normal')  # 设置标题

plt.xlabel('Time (in Seconds)')  # 设置x轴标题
plt.ylabel('Amount')  # 设置y轴标题
plt.show()  # 显示图表
看上去交易时间并不是那么重要。
自动编码
首先,自动编码器看起来很奇怪。这些模型的工作是预测输入,给定相同的输入。百思不得其解?我绝对是第一次听到这个。
更具体地说,我们来看看自动编码器神经网络。此自动编码器尝试学习近似以下恒等函数:
首先尝试这样做可能听起来很简单,但重要的是要注意,我们要学习数据的压缩表示,从而找到结构。这可以通过限制模型中隐藏单位的数量来实现。这些类型的自动编码的被称为undercomplete。
以下是自动编码器可以学习的视觉表示:
重构误差
我们优化自动编码器模型的参数,使特殊类型的误差— 重构误差最小化。在实践中,常常使用传统的平方误差:
如果您想了解更多关于自动编码器的信息,我强烈建议以下Hugo Larochelle的视频:
https://youtu.be/FzS3tMl4Nsc
准备数据
首先,我们删除时间列(不要使用它),并在金额上使用scikit的StandardScaler。缩放器移除平均值并将值缩放为单位方差:
from sklearn.preprocessing import StandardScaler

data = df.drop(['Time'], axis=1)  # 删除时间列

data['Amount'] = StandardScaler().fit_transform(data['Amount'].values.reshape(-1, 1))  # 对金额列进行转换
训练我们的自动编码器将与我们以前使用的有所不同。假设你有一个包含很多非欺诈性交易的数据集。您想要检测新交易的任何异常。我们将通过在正常交易中训练我们的模型来创造这种情况。在测试集上保留正确的类别将为我们提供一种评估我们的模型性能的方法。我们将保留20%的数据进行测试:
X_train, X_test = train_test_split(data, test_size=0.2, random_state=RANDOM_SEED)  # 将数据集20%作为测试集,其余作为训练集
X_train = X_train[X_train.Class == 0]  # 训练集筛选正常交易数据
X_train = X_train.drop(['Class'], axis=1)  # 训练集删除class特征,作为输入特征

y_test = X_test['Class']  # 测试集筛选class特征作为输出特征
X_test = X_test.drop(['Class'], axis=1)  # 测试集删除class特征作为输入特征

X_train = X_train.values  # 转为多维数组值,原DataFrame
X_test = X_test.values  # 转为多维数组值

X_train.shape  # 查看训练集形状
> (227451, 29)
建立模型
我们的自动编码器分别使用4个完全连接的层,分别为14,7,7和29个神经元。前两层用于编码器,最后两层用于解码器。另外,训练期间将使用L1正规化:
input_dim = X_train.shape[1]  # 设定输入层
encoding_dim = 14  # 设定编码层

input_layer = Input(shape=(input_dim, ))  # 添加输入层

encoder = Dense(encoding_dim, activation="tanh",
                activity_regularizer=regularizers.l1(10e-5))(input_layer)  # 编码器输入层使用tanh激活函数
encoder = Dense(int(encoding_dim / 2), activation="relu")(encoder)  # 编码器输出层使用relu激活函数

decoder = Dense(int(encoding_dim / 2), activation='tanh')(encoder)  # 解码器输入层使用tanh激活函数
decoder = Dense(input_dim, activation='relu')(decoder)  # 解码器输出层使用relu激活函数

autoencoder = Model(inputs=input_layer, outputs=decoder)  # 创建自动编码模型
我们训练我们的模型为循环100次,批量大小为32个样本,并将最佳性能模型保存到一个文件。由Keras提供的ModelCheckpoint对于这些任务来说非常方便。此外,训练进度将以TensorBoard了解的格式导出。
nb_epoch = 100  # 设定循环次数
batch_size = 32  # 批次大小

autoencoder.compile(optimizer='adam', loss='mean_squared_error', metrics=['accuracy'])  # 编译自动编码器

checkpointer = ModelCheckpoint(filepath="model.h5", verbose=0, save_best_only=True)  # 将模型保存到h5文件
tensorboard = TensorBoard(log_dir='./logs', histogram_freq=0, write_graph=True,
                          write_images=True)  # 保存训练进度文件

history = autoencoder.fit(X_train, X_train, epochs=nb_epoch, batch_size=batch_size, shuffle=True,
                          validation_data=(X_test, X_test), verbose=1,
                          callbacks=[checkpointer, tensorboard]).history  # 训练模型
并加载保存的模型(只是为了检查它是否工作):
autoencoder = load_model('model.h5') # 加载保存的模型
评估
plt.plot(history['loss'])  # 绘制训练集loss曲线
plt.plot(history['val_loss'])  # 绘制测试集loss曲线
plt.title('model loss')  # 添加标题
plt.ylabel('loss')  # 添加y轴标题
plt.xlabel('epoch') # 添加x轴标题
plt.legend(['train', 'test'], loc='upper right')  # 添加图例
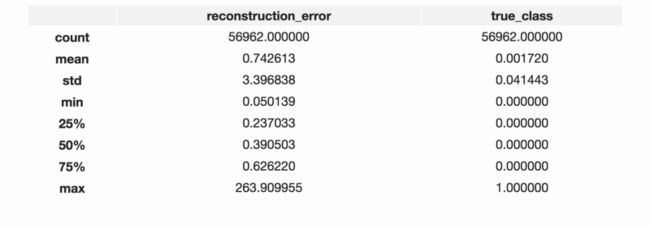
我们的训练和测试数据的重构误差似乎很好地收敛。够低吗?我们来仔细看看错误分布:
predictions = autoencoder.predict(X_test)  # 使用自动编码器训练测试数据集

mse = np.mean(np.power(X_test - predictions, 2), axis=1)  # 计算重构误差值
error_df = pd.DataFrame({'reconstruction_error': mse,
                         'true_class': y_test})  # 将重构误差和真实分类放在一起

error_df.describe()  # 查看描述统计结果
重构误差没有诈欺
fig = plt.figure()  # 创建画布
ax = fig.add_subplot(111)  # 添加图表

# 将真实分类为0且重构误差小于10的数据作为正常误差数据
normal_error_df = error_df[(error_df['true_class']== 0) & (error_df['reconstruction_error'] < 10)]
_ = ax.hist(normal_error_df.reconstruction_error.values, bins=10)  # 绘制正常误差数据重构误差值直方图分布
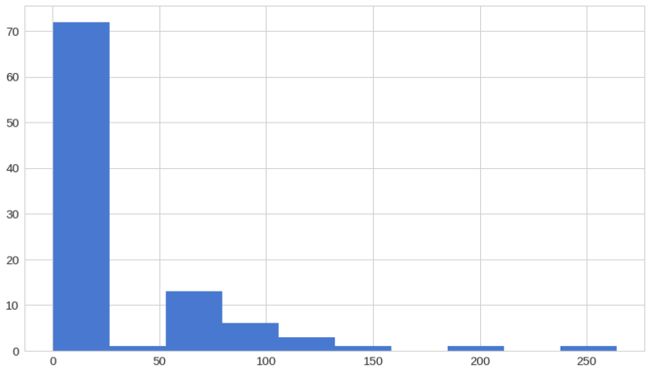
重构误差与诈欺
fig = plt.figure()
ax = fig.add_subplot(111)
fraud_error_df = error_df[error_df['true_class'] == 1]  # 筛选真实分类为1的数据作为诈欺误差数据
_ = ax.hist(fraud_error_df.reconstruction_error.values, bins=10)  # 绘制诈欺误差数据重构误差值直方图分布
from sklearn.metrics import (confusion_matrix, precision_recall_curve, auc,
                             roc_curve, recall_score, classification_report, f1_score,
                             precision_recall_fscore_support)
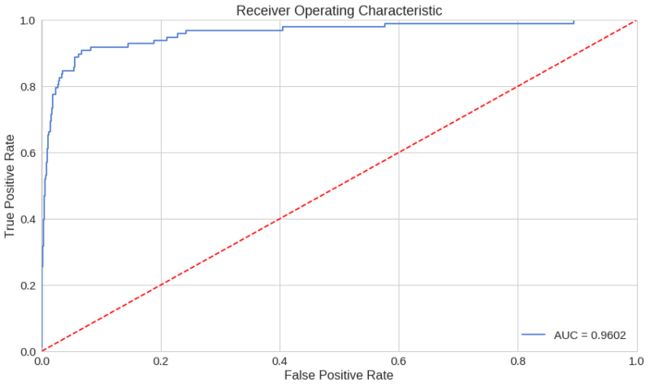
ROC曲线是理解二进制分类器性能的非常有用的工具。不过,我们的情况有点不寻常。我们有一个非常不平衡的数据集。不过,我们来看看我们的ROC曲线:
# 计算ROC曲线值数组
fpr, tpr, thresholds = roc_curve(error_df.true_class, error_df.reconstruction_error)
roc_auc = auc(fpr, tpr)  # 计算曲线面积

plt.title('Receiver Operating Characteristic')
plt.plot(fpr, tpr, label='AUC = %0.4f'% roc_auc)  # 绘制ROC曲线
plt.legend(loc='lower right')  # 设置图例
plt.plot([0,1],[0,1],'r--')  # 绘制0-1的斜线
plt.xlim([-0.001, 1])  # 设定x轴边界
plt.ylim([0, 1.001])  # 设定y轴边界
plt.ylabel('True Positive Rate')
plt.xlabel('False Positive Rate')
plt.show()
ROC曲线绘制了不同阈值对真阳性率与假阳性率的关系。基本上,我们希望蓝线尽可能靠近左上角。虽然我们的结果看起来不错,但我们必须牢记我们的数据集的性质。ROC对我们来说不是很有用。向前…
精确率vs召回率
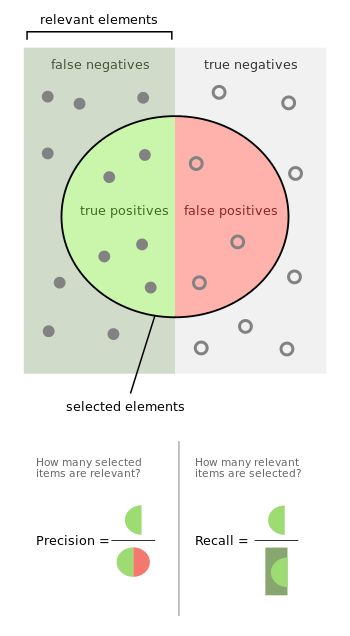
精确率和召回率定义如下:
让我们以信息检索为例,以便更好地了解什么是精确率和召回率。精度测量结果的相关性。回想一下,另一方面,衡量有多少相关结果被归还。这两个值都可以取0到1之间的值。您希望拥有两个值等于1的系统。
让我们回到信息检索的例子。高召回但低精确意味着许多结果,其中大部分具有低或无相关性。当精确很高但是召回很低时,我们有相反的回报结果与相关性很高。理想情况下,您需要高精确率和高召回率 - 与此相关的许多结果是非常重要的。
# 计算召回率和精确率曲线
precision, recall, th = precision_recall_curve(error_df.true_class, error_df.reconstruction_error)
plt.plot(recall, precision, 'b', label='Precision-Recall curve')  # 绘制曲线
plt.title('Recall vs Precision')
plt.xlabel('Recall')
plt.ylabel('Precision')
plt.show()
曲线下的高面积代表高召回率和高精确率,其中高精确度与低假阳性率相关,高召回率涉及低假阴性率。两者的高分表明,分类器返回准确的结果(高精确度),以及返回所有阳性结果的大部分(高召回)。
# 绘制不同阈值下的精确率曲线
plt.plot(th, precision[1:], 'b', label='Threshold-Precision curve')
plt.title('Precision for different threshold values')
plt.xlabel('Threshold')
plt.ylabel('Precision')
plt.show()
您可以看到,由于重构误差也增加了我们的精度上升。我们来看看召回:
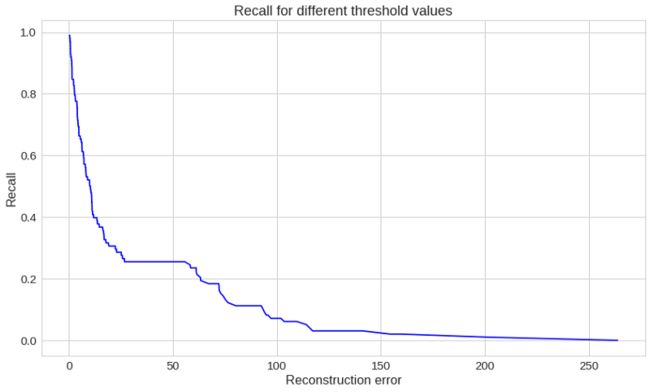
# 绘制不同阈值下的召回率曲线
plt.plot(th, recall[1:], 'b', label='Threshold-Recall curve')
plt.title('Recall for different threshold values')
plt.xlabel('Reconstruction error')
plt.ylabel('Recall')
plt.show()
在这里,我们有完全相反的情况。随着重构误差的增加,召回率减小。
预测
这次我们的模型有点不同。它不知道如何预测新的数值。但是我们不需要这个。为了预测新/不可见的交易是否正常或欺诈,我们将从交易数据本身计算重构误差。如果误差大于预定阈值,我们将其标记为欺诈(因为我们的模型在正常交易中应该有一个低错误)。让我们选择这个值:
threshold = 2.9
注:作者没有说明设定阈值为2.9原因。
看看我们如何划分两种类型的交易:
groups = error_df.groupby('true_class')  # 对误差数据进行分组
fig, ax = plt.subplots()

# 绘制不同分类的重构误差散点图
for name, group in groups:
    ax.plot(group.index, group.reconstruction_error, marker='o', ms=3.5, linestyle='',
            label= "Fraud" if name == 1 else "Normal")

# 绘制阈值线
ax.hlines(threshold, ax.get_xlim()[0], ax.get_xlim()[1], colors="r", zorder=100, label='Threshold')
ax.legend()
plt.title("Reconstruction error for different classes")
plt.ylabel("Reconstruction error")
plt.xlabel("Data point index")
plt.show()
我知道,这张图表可能有点掩耳盗铃。我们来看看混淆矩阵:
# 将重构误差值进行重新编码
y_pred = [1 if e > threshold else 0 for e in error_df.reconstruction_error.values]
conf_matrix = confusion_matrix(error_df.true_class, y_pred)
plt.figure(figsize=(12, 12))  # 设定画布大小
# 绘制混淆矩阵图
sns.heatmap(conf_matrix, xticklabels=LABELS, yticklabels=LABELS, annot=True, fmt="d")
plt.title("Confusion matrix")
plt.ylabel('True class')
plt.xlabel('Predicted class')
plt.show()
我们的模式似乎抓住了很多欺诈案例。当然,有一个catch(看我在那里做什么)?分类为欺诈的正常交易数量真的很高。这真的是一个问题吗?可能是您可能希望根据问题增加或减少阈值的值。哪一个取决于你。
结论
我们在Keras创建了一个非常简单的Deep Autoencoder,可以重构非欺诈交易的样子。最初,我有点怀疑这件事情是否会解决,有点像这样。想想一下,我们给了一个模型很多一类的例子(正常交易),并且学习(有些)如何区分新的例子是否属于同一个类。不是很酷吗?我们的数据集有点神奇。我们真的不知道原始的特征是什么样的。
Keras给了我们非常干净,易于使用的API来构建一个非常简单的Deep Autoencoder。您可以搜索TensorFlow实现,并为自己查看您需要多少样本来训练一个模型。您可以将类似的模型应用于其他问题吗?
源代码和预测模型可在GitHub上找到。
参考
- 在Keras建立自动编码器
- 斯坦福自动编码器教程
- TensorFlow中堆叠的自动编码器
原文地址:https://medium.com/@curiousily/credit-card-fraud-detection-using-autoencoders-in-keras-tensorflow-for-hackers-part-vii-20e0c85301bd

