- 坐标轴:QCPAxis(xAxis,yAxis,xAxis1,yAxis2等四个成员变量)
setTickStep(double step);//设置刻度间距
setTickVector(const QVector &vec);//将坐标刻度设置为vec
customPlot->legend->setVisible(true);  //图例legend
QFont legendFont = font();
legendFont.setPointSize(9);
customPlot->legend->setFont(legendFont);
customPlot->legend->setBrush(QBrush(QColor(255,255,255,230)));  //填充色
customPlot->axisRect()->insetLayout()->setInsetAlignment(0, Qt::AlignBottom|Qt::AlignRight);
customPlot->addGraph(customPlot->yAxis, customPlot->xAxis);
customPlot->graph(0)->setPen(QPen(QColor(255, 100, 0))); //折线笔色
customPlot->graph(0)->setBrush(QBrush(QPixmap("./dali.png")));  //填充图片
customPlot->graph(0)->setLineStyle(QCPGraph::lsLine);
customPlot->graph(0)->setScatterStyle(QCPScatterStyle(QCPScatterStyle::ssDisc, 5)); //折线风格
customPlot->graph(0)->setName("Left maxwell function"); //折线名称
// prepare data:
QVector x1(20), y1(20);
QVector x2(100), y2(100);
QVector x3(20), y3(20);
QVector x4(20), y4(20);
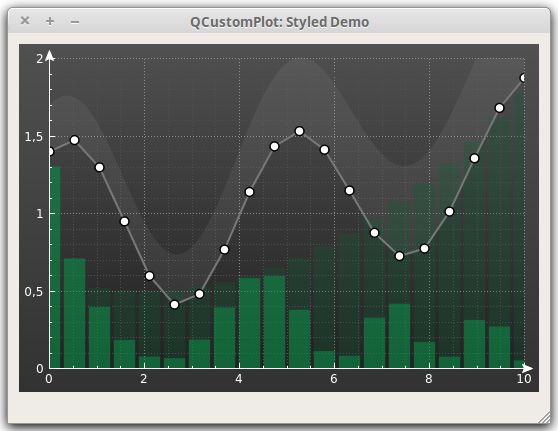
for (int i=0; iaddGraph();
graph1->setData(x1, y1);
graph1->setScatterStyle(QCPScatterStyle(QCPScatterStyle::ssCircle, QPen(Qt::black, 1.5), QBrush(Qt::white), 9));
graph1->setPen(QPen(QColor(120, 120, 120), 2));

QCPGraph *graph2 = customPlot->addGraph();
graph2->setData(x2, y2);
graph2->setPen(Qt::NoPen);
graph2->setBrush(QColor(200, 200, 200, 20));
graph2->setChannelFillGraph(graph1);

QCPBars *bars1 = new QCPBars(customPlot->xAxis, customPlot->yAxis);
bars1->setWidth(9/(double)x3.size());
bars1->setData(x3, y3);
bars1->setPen(Qt::NoPen);
bars1->setBrush(QColor(10, 140, 70, 160));

QCPBars *bars2 = new QCPBars(customPlot->xAxis, customPlot->yAxis);
bars2->setWidth(9/(double)x4.size());
bars2->setData(x4, y4);
bars2->setPen(Qt::NoPen);
bars2->setBrush(QColor(10, 100, 50, 70));
bars2->moveAbove(bars1);

// move bars above graphs and grid below bars:
customPlot->addLayer("abovemain", customPlot->layer("main"), QCustomPlot::limAbove);
customPlot->addLayer("belowmain", customPlot->layer("main"), QCustomPlot::limBelow);
graph1->setLayer("abovemain");
customPlot->xAxis->grid()->setLayer("belowmain");
customPlot->yAxis->grid()->setLayer("belowmain");

// set some pens, brushes and backgrounds:
customPlot->xAxis->setBasePen(QPen(Qt::white, 1));
customPlot->yAxis->setBasePen(QPen(Qt::white, 1));
customPlot->xAxis->setTickPen(QPen(Qt::white, 1));
customPlot->yAxis->setTickPen(QPen(Qt::white, 1));
customPlot->xAxis->setSubTickPen(QPen(Qt::white, 1));
customPlot->yAxis->setSubTickPen(QPen(Qt::white, 1));
customPlot->xAxis->setTickLabelColor(Qt::white);
customPlot->yAxis->setTickLabelColor(Qt::white);
customPlot->xAxis->grid()->setPen(QPen(QColor(140, 140, 140), 1, Qt::DotLine));
customPlot->yAxis->grid()->setPen(QPen(QColor(140, 140, 140), 1, Qt::DotLine));
customPlot->xAxis->grid()->setSubGridPen(QPen(QColor(80, 80, 80), 1, Qt::DotLine));
customPlot->yAxis->grid()->setSubGridPen(QPen(QColor(80, 80, 80), 1, Qt::DotLine));
customPlot->xAxis->grid()->setSubGridVisible(true);
customPlot->yAxis->grid()->setSubGridVisible(true);
customPlot->xAxis->grid()->setZeroLinePen(Qt::NoPen);
customPlot->yAxis->grid()->setZeroLinePen(Qt::NoPen);
customPlot->xAxis->setUpperEnding(QCPLineEnding::esSpikeArrow);
customPlot->yAxis->setUpperEnding(QCPLineEnding::esSpikeArrow);
QLinearGradient plotGradient;
plotGradient.setStart(0, 0);
plotGradient.setFinalStop(0, 350);
plotGradient.setColorAt(0, QColor(80, 80, 80));
plotGradient.setColorAt(1, QColor(50, 50, 50));
customPlot->setBackground(plotGradient);
QLinearGradient axisRectGradient;
axisRectGradient.setStart(0, 0);
axisRectGradient.setFinalStop(0, 350);
axisRectGradient.setColorAt(0, QColor(80, 80, 80));
axisRectGradient.setColorAt(1, QColor(30, 30, 30));
customPlot->axisRect()->setBackground(axisRectGradient);

customPlot->rescaleAxes();
customPlot->yAxis->setRange(0, 2);
