matplotlib.pyplot 的基本绘图
matplotlib的pyplot子库提供了与matlab类似绘图API,方便用户快速绘制一些常用的基本图表
以下基本是给自己留档用的,以及让自己不用每次都查文档这么累= =
figure 和 axes
\(\quad\quad\) figure和axes是plt中的对象名称,注意区别axes和axis区别,一般把axes翻译为“子图”
\(\quad\quad\) figure一般理解为一个画板,对应的是一个对话框(在ipython中)
\(\quad\quad\) pyplot中常用类包含关系 Figure -> Axes -> (Line2D, Text, etc.)
import matplotlib.pyplot as plt
fig = plt.figure()
ax1 = fig.add_subplot(2,3,1) #add_subplot(231) is acceptable
\(\quad\quad\) 这里引入了fig中add_subplot的用法
\(\quad\quad\) fig.add_subplot相当于plt.subplot,起到创建子图的作用,参数231相当于:
\(\quad\quad\) \(\quad\quad\) “把figure划分为2行3列,并取ax1为第1个图(从上到下从左往右)”
\(\quad\quad\) 这里再讲一个plt.subplots的用法
fig, axes = plt.subplots(2,3)
\(\quad\quad\) axes就成为了一个可以被索引的二维数组,非常棒棒
常用画图函数以及参数
绘制散点图
plt.scatter(x = , y = , )
绘制曲线图
plt.plot(x = , y = , linestyle = , color = , marker = ,markerfacecolor = ,drawstyle = ,label = )
- x, y :array-like object
- linestyle,color:线型和颜色
- marker, markerfacecolor:点型和颜色
- drawstyle:插值方式(steps-post,阶跃;Default,线型)
- 绘制直方图
plt.hist(x = , bins = , range = , normed = ,histtype = )- histtype:改为stepfilled可以去除bin间隔线看上去更连续
刻度、标签以及图例
对坐标轴上数据的设置
- ax.set_xlabel([]):设置x轴名称
- ax.set_xlim():设置x轴范围
- ax.set_xticks([]):设置坐标刻度值
- ax.set_xticklabels([], rotation = ,fontsize = ):设置坐标刻度标签
图例设置
ax.legend([plot1, plot2, ...], ('label1', 'label2'), loc = )- loc:图例位置(best,自适应:center,中间)
标签设置
ax.set_title():设置子图标题
保存图表
- plt.savefig('example.png')
seaborn库绘图进阶
使用axes_style()和set_style()设置外观
\(\quad\quad\)暗网格(darkgrid),白网格(whitegrid),全黑(dark),全白(white),全刻度(ticks)
对数据集的可视化
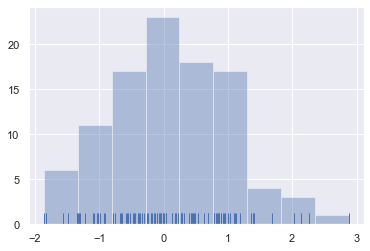
- distplot(a = array-like, bins =, hist = , norm_hist =, rug = , kde = ,fit =)
- hist:是否显示直方图
- kde:是否显示kde曲线
- fit:可以调用method拟合直方图
kdeplot() 类似distplot的kde部分,只是更方便做阴影
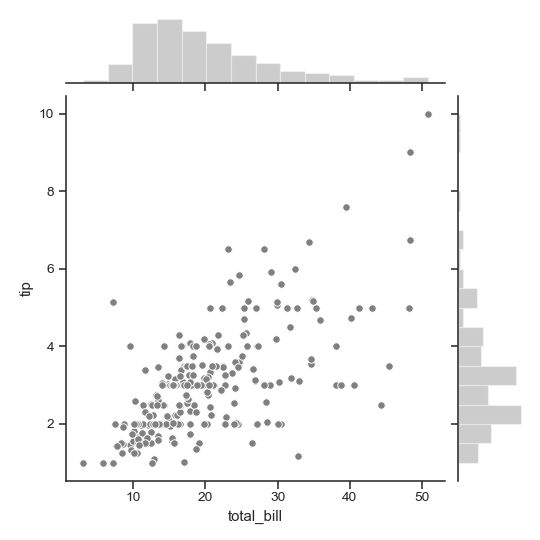
jointplot() 绘制联合分布,默认为散点图,通过设置kind可以更改图的属性
"hex":Hexbin “kde": KDE “reg”:regression line
- heatmap() 绘制热点图
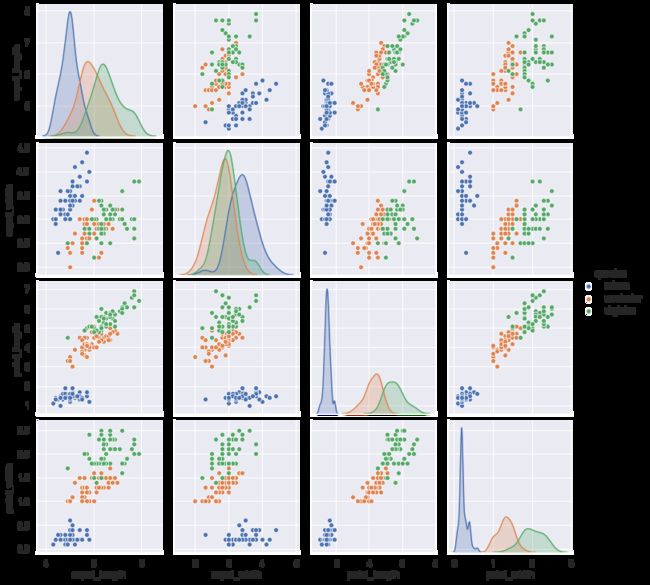
- pairplot()


