Pyecharts V1全新版本使用教程(1)
前言
pyecharts是一款将python与echarts结合的强大的数据可视化工具,由于v0.5.x 和 V1 间不兼容,导致很多代码不可复用,旧版本将不再维护,本文将简单介绍新版本的使用方法。
Github地址
https://github.com/pyecharts/pyecharts
使用教程:
https://pyecharts.org/#/zh-cn/quickstart
安装
最新版本:pip install pyecharts
若需要使用旧版本,可用命令:pip install pyecharts==0.5.11
导入方式
v0.5x版本:
from pyecharts import Bar, Pie, Gridv1.0版本:
from pyecharts.charts import Bar, Pie, Grid简单示例
饼状图
from pyecharts.charts import Bar
from pyecharts import options as opts

# V1 版本开始支持链式调用
bar = (
    Bar()
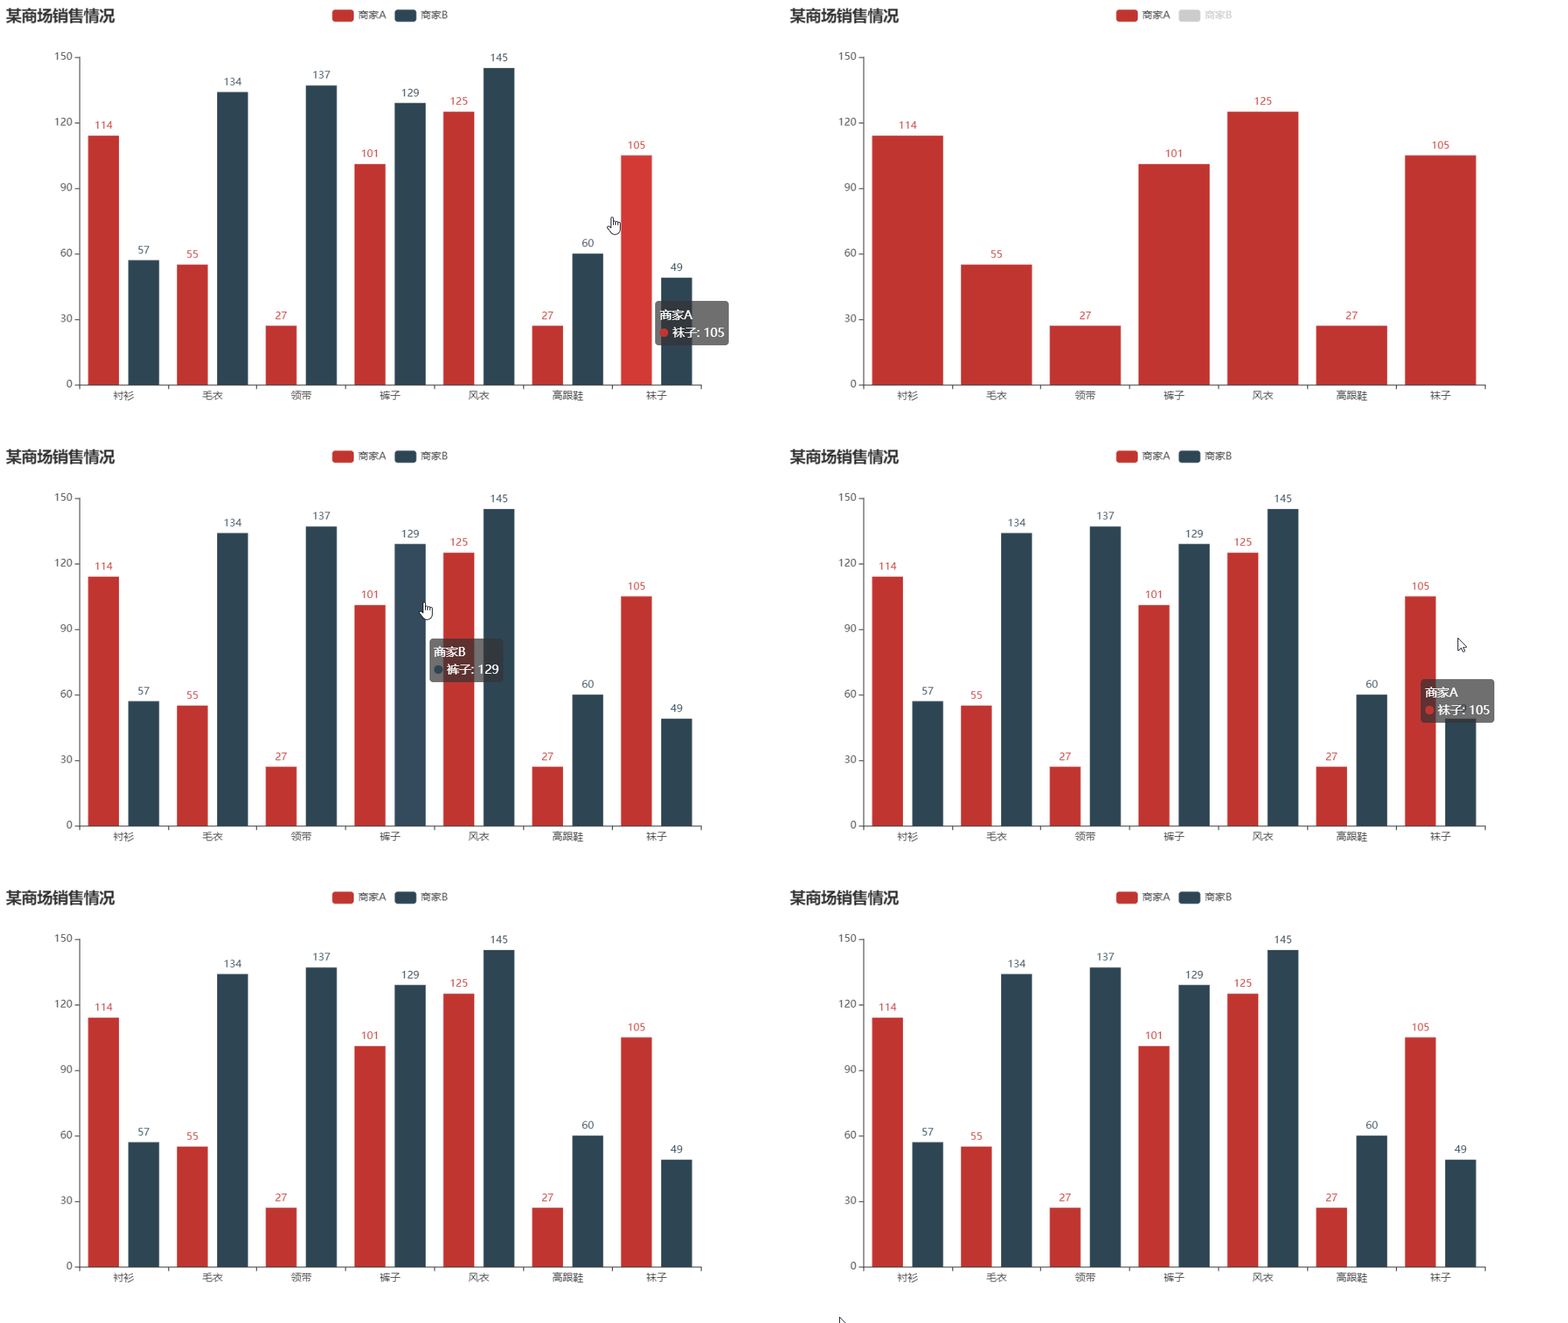
    .add_xaxis(["衬衫", "毛衣", "领带", "裤子", "风衣", "高跟鞋", "袜子"])
    .add_yaxis("商家A", [114, 55, 27, 101, 125, 27, 105])
    .add_yaxis("商家B", [57, 134, 137, 129, 145, 60, 49])
    .set_global_opts(title_opts=opts.TitleOpts(title="某商场销售情况"))
)
bar.render()

# 不习惯链式调用的开发者依旧可以单独调用方法
bar = Bar()
bar.add_xaxis(["衬衫", "毛衣", "领带", "裤子", "风衣", "高跟鞋", "袜子"])
bar.add_yaxis("商家A", [114, 55, 27, 101, 125, 27, 105])
bar.add_yaxis("商家B", [57, 134, 137, 129, 145, 60, 49])
bar.set_global_opts(title_opts=opts.TitleOpts(title="某商场销售情况"))
bar.render()
使用主题
pyecharts 提供了 10+ 种内置主题,开发者也可以定制自己喜欢的主题,详见使用教程。
from pyecharts.charts import Bar
from pyecharts import options as opts
# 内置主题类型可查看 pyecharts.globals.ThemeType
from pyecharts.globals import ThemeType

bar = (
    Bar(init_opts=opts.InitOpts(theme=ThemeType.LIGHT))
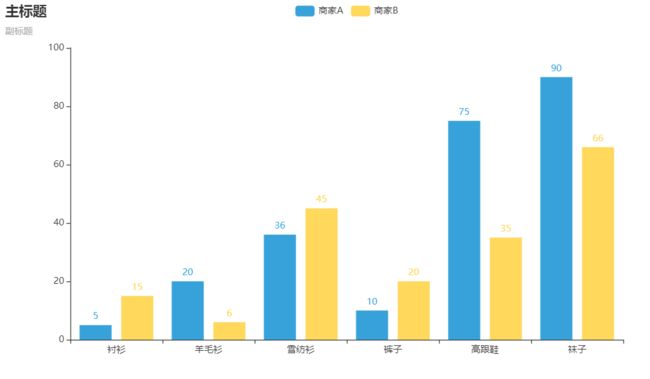
    .add_xaxis(["衬衫", "羊毛衫", "雪纺衫", "裤子", "高跟鞋", "袜子"])
    .add_yaxis("商家A", [5, 20, 36, 10, 75, 90])
    .add_yaxis("商家B", [15, 6, 45, 20, 35, 66])
    .set_global_opts(title_opts=opts.TitleOpts(title="主标题", subtitle="副标题"))
)
在jupyter中使用,只需要使用xxx.render_notebook() 方法即可在Jupyter中显示图
其他类型的图可参考饼状图,更多使用方法请访问使用教程。

