吴恩达机器学习课后习题ex1(python实现)
ex1
- 单变量线性回归
- 多变量线性回归
- bug提醒(可能会犯的错误)
吴恩达机器学习资料获取
单变量线性回归
问题背景:假如你是餐馆老板,已知若干城市中人口和利润的数据(ex1data1.txt),用线性回归方法计算该去哪个城市发展。
#导入
import numpy as np
import pandas as pd
import matplotlib.pyplot as plt
path='ex1data1.txt'
data=pd.read_csv(path,header=None,names = ['population','profit'])  #read_csv读取的数据类型为Dataframe
data.head()
这里解释一下read_csv中的header参数,刚开始我默认header=0,data少了第一行,需要注意的是,对于一个没有字段名标题的数据,header=0会把数据内容的第一行默认为字段名标题,所以这种情况需要header=None,告诉函数,我们读取的原始文件数据没有列索引。
data.plot(kind="scatter",x='population',y='profit')
plt.show()
接下来处理x和y
y = θ 0 ∗ x 0 + θ 1 ∗ x 1 y =\theta_0*x_0+\theta_1*x_1 y=θ0∗x0+θ1∗x1 这里 x 0 x_0 x0是我们添加的,默认为1,方便后面进行矩阵运算。
data.insert(0,"ones",1) #加入全为1的第0列
cols=data.shape[1] #data的列数
#分开x、y
x=data.iloc[:,0:cols-1]
y=data.iloc[:,cols-1:cols]
#将dataframe类型转换为ndarray类型,不要忘记!
x=np.array(x.values)
y=np.array(y.values)
theta=np.zeros((1,2))
J ( θ 0 , θ 1 ) = ∑ i = 1 m ( h ( x i ) − y i ) 2 ∗ 1 2 m J(\theta_0,\theta_1)=\sum_{i=1}^m{(h(x^i)-y^i)^2}*\frac{1}{2m} J(θ0,θ1)=∑i=1m(h(xi)−yi)2∗2m1
#定义代价函数
def computecost(x,y,theta):
  tmp1=np.power((x.dot(theta.T)-y),2)
  tmp2=np.sum(tmp1)
  return tmp2/(2*len(x))
最重要的梯度下降函数
梯度下降方法求出最优值,最小化代价函数
θ j = θ j − a ∗ ∂ J ( θ ) ∂ θ j \theta_j=\theta_j-a*{\frac{\partial J(\theta)}{\partial \theta_j} } θj=θj−a∗∂θj∂J(θ)
def gradientdescent(x,y,theta,iters,lr):
  num=theta.shape[1]
  cost=np.zeros(1,iters)
  tmp=np.zeros(theta.shape)
  for i in range(iters):  #迭代次数
    ji=x*theta.T-y
    for j in range(num):     #参数个数
      inter=np.multiply(error,x[,:j])
      tmp[:j]=tmp[:j]-(lr/len(x))*inter
   theta=tmp
   cost=computecost(x,y,theta)
   return theta,cost
lr=0.01
iters=1000
a,cost=gradientdescent(x,y,theta,iters,lr)
a
computecost(x,y,a)
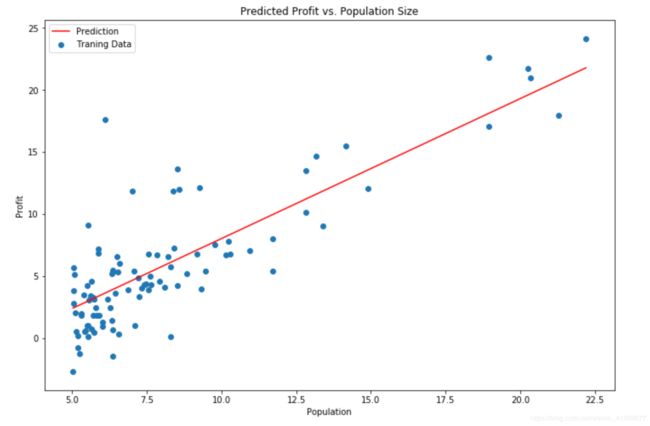
x=np.linspace(data.population.min(),data.population.max(),100)
y=a[0,0]+a[0,1]*x
fig,ax=plt.subplots(figsize(12,8))
ax.plot(x,f,'r',label='Prediction')
ax.scatter(data.population,data.profit,label='Traning Data')
ax.legend(2)
ax.set_xlabel('Population')
ax.set_ylabel('profit')
ax.set_title('Predicted Profit vs. Population Size')
plt.show()
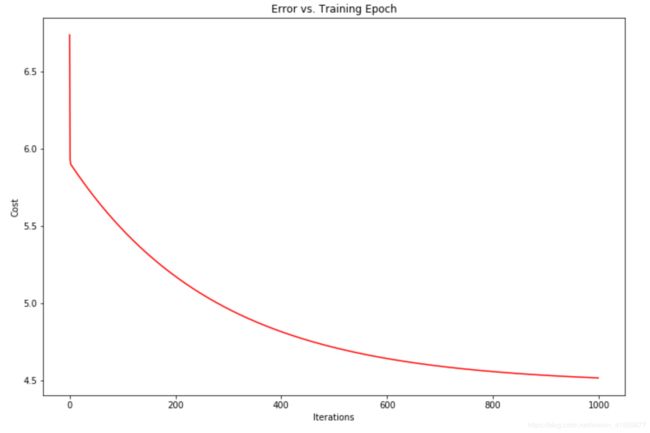
fig,ax=plt.subplots(figsize(12,8))
ax.plot(np.arange(iters),cost,'r')
ax.set_xlabel('Iterations')
ax.set_ylabel('Cost')
ax.set_title('Error vs. Training Epoch')
plt.show()
多变量线性回归
import numpy as np
import pandas as pd
import matplotlib.pyplot as plt
import types
path='ex1data2.txt'
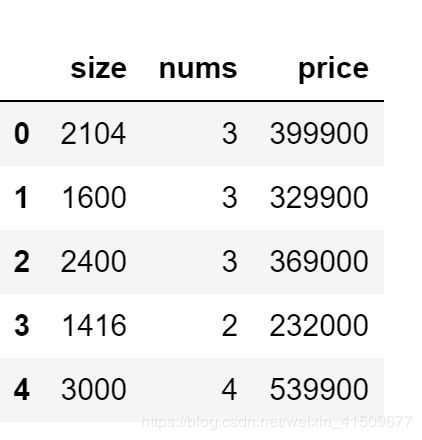
data=pd.read_csv(path,header=None,names=['size','nums','price'])
data.head()
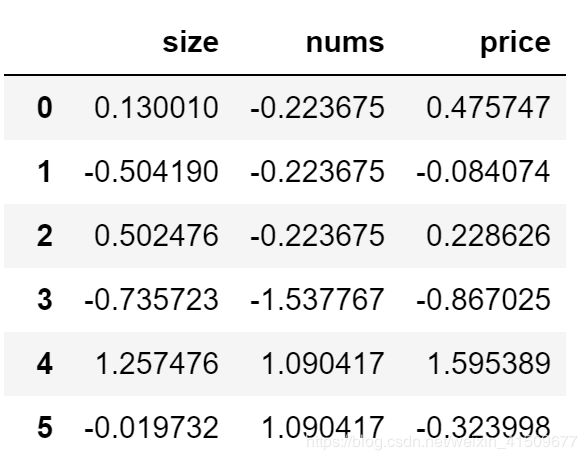
#归一化
data=(data-data.mean())/data.std()
data
也可以使用scikit-learn的线性回归函数,而不是从头开始实现这些算法。
from sklearn import linear_model
from sklearn.preprocessing import StandardScaler    #引入缩放的包
model=linear_model.LinearRegression()
model.fit(x,y)
x = np.array(x[:, 1].A1)
f = model.predict(x).flatten()
吴恩达老师还提出了正规方程求解,不需要选择学习率α,一次计算得出,如果特征数量n较大则运算代价大,因为矩阵逆的计算时间复杂度为 O(n3) ,通常来说当 n 小于10000 时还是可以接受的,只适用于线性模型,不适合逻辑回归模型等其他模型
θ = ( X T ∗ X ) − 1 X T y \theta=(X^T*X)^{-1}X^Ty θ=(XT∗X)−1XTy
def normalEqn(X, y):
    theta = np.linalg.inv(X.T@X)@X.T@y#X.T@X等价于X.T.dot(X)
    return theta
final_theta2=normalEqn(x, y)#感觉和批量梯度下降的theta的值有点差距
final_theta2
bug提醒(可能会犯的错误)
- 我报了一个这个bug,通过百度发现我的x和theta都是numpy的ndarray形式,而乘积C = AB是需要类型的! 解决方案,不用""符号,使用numpy中的dot()函数,可以实现两个二维数组的乘积,或者将数组类型转化为矩阵类型,使用相乘,np.matrix() 。
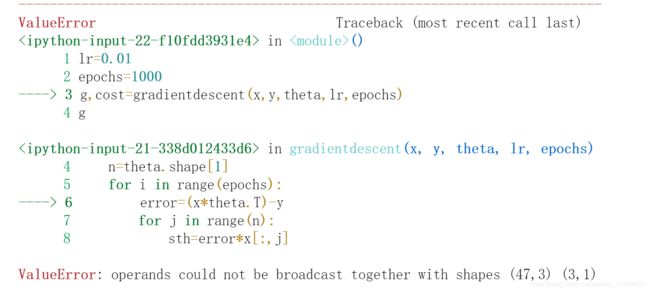
具体np.multiply()、dot()、 的区别可以参考博客,很详细的解释。 - 在进行多变量线性回归时又出错了,我吐了…这是power、multiply函数发生了溢出,不同的变量之间数量级相差过大,这里我们需要进行预处理——特征归一化

data=(data-data.mean())/data.std()


