使用EFK搭建日志采集系统
背景需求
- 业务发展越来越庞大,服务器越来越多
- 各种访问日志、应用日志、错误日志量越来越多,导致运维人员无法很好的去管理日志
- 开发人员排查问题,需要到服务器上查日志,不方便
- 运营人员需要一些数据,需要我们运维到服务器上分析日志
前言
Logstash
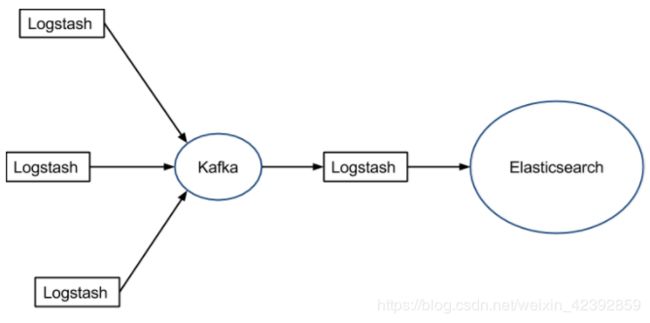
在之前的日志系统的采集过程中,几乎大多数都使用ELK来进行采集,Logstash 主要的优点就是它的灵活性,这还主要因为它有很多插件。然后它清楚的文档已经直白的配置格式让它可以再多种场景下应用,但是Logstash 致命的问题是它的性能以及资源消耗(默认的堆大小是 1GB)。尽管它的性能在近几年已经有很大提升,与它的替代者们相比还是要慢很多的。
它在大数据量的情况下会是个问题。而且Logstash 是不支持缓存的。通常会使用redis或者kafka作为中心缓存池

FileBeat
作为 Beats 家族的一员,Filebeat 是一个轻量级的日志传输工具,它的存在正弥补了 Logstash 的缺点:Filebeat 作为一个轻量级的日志传输工具可以将日志推送到中心 Logstash,而且FileBeat可以使用pipeline做到简单的数据数据处理进行导入ElasticSearch中。
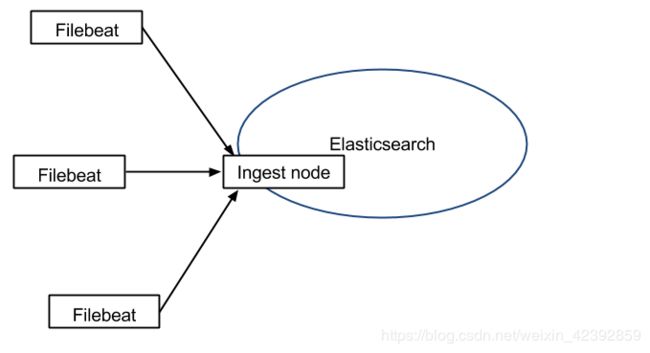
在版本 5.x 中,Elasticsearch 具有解析的能力(像 Logstash 过滤器)— Ingest。这也就意味着可以将数据直接用 Filebeat 推送到 Elasticsearch,并让 Elasticsearch 既做解析的事情,又做存储的事情。也不需要使用缓冲,因为 Filebeat 也会和 Logstash 一样记住上次读取的偏移:

如果需要缓存的话,也可以进行加入Redis或者Kafka进行缓冲

使用
官方下载网站
本次使用的为基于6.7.0版本进行搭建
ElasticSearch: https://www.elastic.co/cn/downloads/past-releases/elasticsearch-6-7-0
FileBeat: https://www.elastic.co/cn/downloads/past-releases/filebeat-6-7-0
kibana: https://www.elastic.co/cn/downloads/past-releases/kibana-6-7-0
注意:三个版本要相同
配置
ElasticSearch的配置:
注意:在linux系统下,Es不允许Root用于直接登陆。需要使用其他拥有此操作权限的用户进行操作
Es的配置文件在/elasticsearch-6.7.0/config/elasticsearch.yml中
# The primary way of configuring a node is via this file. This template lists
# the most important settings you may want to configure for a production cluster.
#
# Please consult the documentation for further information on configuration options:
# https://www.elastic.co/guide/en/elasticsearch/reference/index.html
#
# ---------------------------------- Cluster -----------------------------------
#
# Use a descriptive name for your cluster:
# 集群名称,单机使用默认,集群模式下需要设置相同的集群名字
#cluster.name: my-application
#
# ------------------------------------ Node ------------------------------------
#
# Use a descriptive name for the node:
#节点名称,集群模式下需要不同
#node.name: node-1
#
# Add custom attributes to the node:
#
#node.attr.rack: r1
#
# ----------------------------------- Paths ------------------------------------
#
# Path to directory where to store the data (separate multiple locations by comma):
#数据所在地方
#path.data: /path/to/data
#
# Path to log files:
#日志文件所在地方
#path.logs: /path/to/logs
#
# ----------------------------------- Memory -----------------------------------
#
# Lock the memory on startup:
#
#bootstrap.memory_lock: true
#
# Make sure that the heap size is set to about half the memory available
# on the system and that the owner of the process is allowed to use this
# limit.
#
# Elasticsearch performs poorly when the system is swapping the memory.
#
# ---------------------------------- Network -----------------------------------
#
# Set the bind address to a specific IP (IPv4 or IPv6):
#对外暴露的地址,如果需要外网能够访问,需要指定成0.0.0.0
#network.host: 192.168.0.1
network.host: 0.0.0.0
#
# Set a custom port for HTTP:
#对外暴露的端口。默认为9200 集群模式下,需要端口不相同
http.port: 9200
#
# For more information, consult the network module documentation.
#
# --------------------------------- Discovery ----------------------------------
# 集群模式下的配置,单机不需要进行配置
# Pass an initial list of hosts to perform discovery when new node is started:
# The default list of hosts is ["127.0.0.1", "[::1]"]
#
#discovery.zen.ping.unicast.hosts: ["host1", "host2"]
#
# Prevent the "split brain" by configuring the majority of nodes (total number of master-eligible nodes / 2 + 1):
#
#discovery.zen.minimum_master_nodes:
#
# For more information, consult the zen discovery module documentation.
#
# ---------------------------------- Gateway -----------------------------------
#可以设置账号密码相关的操作
# Block initial recovery after a full cluster restart until N nodes are started:
#
#gateway.recover_after_nodes: 3
#
# For more information, consult the gateway module documentation.
#
# ---------------------------------- Various -----------------------------------
#
# Require explicit names when deleting indices:
#
#action.destructive_requires_name: true
启动Es: …/bin/elasticsearch
启动会遇到的问题汇总:
max file descriptors [65535] for elasticsearch process is too low, increase to at least [65536]
解决办法:
   vim /etc/security/limits.conf
   #<domain>   <type>  <item>  <value>
   #添加以下内容
   #四个元素的意义在该文件中均有详细描述
   elasticsearch soft nofile 65536
   elasticsearch hard nofile 65536
max virtual memory areas vm.max_map_count [65530] is too low, increase to at least [262144]
   vim /etc/sysctl.conf
   #添加以下配置
   vm.max_map_count=655360
   #重新启动
   sysctl -p
failed to send join request to master.can't add node found existing node with the same id but is a different node instance.
如果es的data存储路径在es文件夹下,在拷贝已被启动过的es文件夹的时候,data路径下已生成了节点的信息。所以只需要删除配置的data路径下的东西即可。
FileBeat的配置:
FileBeat的配置文件在/filebeat-6.7.1-linux-x86_64/filebeat.yml中
    ###################### Filebeat Configuration Example #########################

# This file is an example configuration file highlighting only the most common
# options. The filebeat.reference.yml file from the same directory contains all the
# supported options with more comments. You can use it as a reference.
#
# You can find the full configuration reference here:
# https://www.elastic.co/guide/en/beats/filebeat/index.html

# For more available modules and options, please see the filebeat.reference.yml sample
# configuration file.

#=========================== Filebeat inputs =============================

filebeat.inputs:

# Each - is an input. Most options can be set at the input level, so
# you can use different inputs for various configurations.
# Below are the input specific configurations.

  #设置类型为日志
- type: log

  # Change to true to enable this input configuration.
  enabled: true

  # Paths that should be crawled and fetched. Glob based paths.
  #要监控的目录
  paths:
    - /var/log/*.log

  # Exclude lines. A list of regular expressions to match. It drops the lines that are
  # matching any regular expression from the list.
  #exclude_lines: ['^DBG']

  # Include lines. A list of regular expressions to match. It exports the lines that are
  # matching any regular expression from the list.
  #include_lines: ['^ERR', '^WARN']

  # Exclude files. A list of regular expressions to match. Filebeat drops the files that
  # are matching any regular expression from the list. By default, no files are dropped.
  #exclude_files: ['.gz$']

  # Optional additional fields. These fields can be freely picked
  # to add additional information to the crawled log files for filtering
  #fields:
  #  level: debug
  #  review: 1

  ### Multiline options

  # Multiline can be used for log messages spanning multiple lines. This is common
  # for Java Stack Traces or C-Line Continuation

  # The regexp Pattern that has to be matched. The example pattern matches all lines starting with [
  #multiline.pattern: ^\[

  # Defines if the pattern set under pattern should be negated or not. Default is false.
  #multiline.negate: false

  # Match can be set to "after" or "before". It is used to define if lines should be append to a pattern
  # that was (not) matched before or after or as long as a pattern is not matched based on negate.
  # Note: After is the equivalent to previous and before is the equivalent to to next in Logstash
  #multiline.match: after


#============================= Filebeat modules ===============================

filebeat.config.modules:
  # Glob pattern for configuration loading
  path: ${path.config}/modules.d/*.yml

  # Set to true to enable config reloading
  ##设置监听变化
  reload.enabled: true

  # Period on which files under path should be checked for changes
  #reload.period: 10s

#==================== Elasticsearch template setting ==========================

setup.template.settings:
  #index.number_of_shards: 3
  #index.codec: best_compression
  #_source.enabled: false

#================================ General =====================================

# The name of the shipper that publishes the network data. It can be used to group
# all the transactions sent by a single shipper in the web interface.
#name:

# The tags of the shipper are included in their own field with each
# transaction published.
#tags: ["service-X", "web-tier"]

# Optional fields that you can specify to add additional information to the
# output.
#fields:
#  env: staging


#============================== Dashboards =====================================
# These settings control loading the sample dashboards to the Kibana index. Loading
# the dashboards is disabled by default and can be enabled either by setting the
# options here, or by using the `-setup` CLI flag or the `setup` command.
#setup.dashboards.enabled: false

# The URL from where to download the dashboards archive. By default this URL
# has a value which is computed based on the Beat name and version. For released
# versions, this URL points to the dashboard archive on the artifacts.elastic.co
# website.
#setup.dashboards.url:

#============================== Kibana =====================================

# Starting with Beats version 6.0.0, the dashboards are loaded via the Kibana API.
# This requires a Kibana endpoint configuration.
setup.kibana:

  # Kibana Host
  # Scheme and port can be left out and will be set to the default (http and 5601)
  # In case you specify and additional path, the scheme is required: http://localhost:5601/path
  # IPv6 addresses should always be defined as: https://[2001:db8::1]:5601
  host: "localhost:5601"

  # Kibana Space ID
  # ID of the Kibana Space into which the dashboards should be loaded. By default,
  # the Default Space will be used.
  #space.id:

#============================= Elastic Cloud ==================================

# These settings simplify using filebeat with the Elastic Cloud (https://cloud.elastic.co/).

# The cloud.id setting overwrites the `output.elasticsearch.hosts` and
# `setup.kibana.host` options.
# You can find the `cloud.id` in the Elastic Cloud web UI.
#cloud.id:

# The cloud.auth setting overwrites the `output.elasticsearch.username` and
# `output.elasticsearch.password` settings. The format is `:`.
#cloud.auth:

#================================ Outputs =====================================

# Configure what output to use when sending the data collected by the beat.

#-------------------------- Elasticsearch output ------------------------------
output.elasticsearch:
  # Array of hosts to connect to.
  hosts: ["localhost:9200"]
  #index: "filebeat-nginx-%{+yyyy.MM.dd}"
  # Enabled ilm (beta) to use index lifecycle management instead daily indices.
  #ilm.enabled: false
  setup.template.name: "filebeat_nginx"
  setup.template.overwrite: false
  setup.template.pattern: "filebeat_nginx*"
  # Optional protocol and basic auth credentials.
  #protocol: "https"
  #username: "elastic"
  #password: "changeme"

#----------------------------- Logstash output --------------------------------
#output.logstash:
  # The Logstash hosts
  #hosts: ["localhost:5044"]

  # Optional SSL. By default is off.
  # List of root certificates for HTTPS server verifications
  #ssl.certificate_authorities: ["/etc/pki/root/ca.pem"]

  # Certificate for SSL client authentication
  #ssl.certificate: "/etc/pki/client/cert.pem"

  # Client Certificate Key
  #ssl.key: "/etc/pki/client/cert.key"

#================================ Processors =====================================

# Configure processors to enhance or manipulate events generated by the beat.

processors:
  - add_host_metadata: ~
  - add_cloud_metadata: ~

#================================ Logging =====================================

# Sets log level. The default log level is info.
# Available log levels are: error, warning, info, debug
#logging.level: debug

# At debug level, you can selectively enable logging only for some components.
# To enable all selectors use ["*"]. Examples of other selectors are "beat",
# "publish", "service".
#logging.selectors: ["*"]

#============================== Xpack Monitoring ===============================
# filebeat can export internal metrics to a central Elasticsearch monitoring
# cluster.  This requires xpack monitoring to be enabled in Elasticsearch.  The
# reporting is disabled by default.

# Set to true to enable the monitoring reporter.
#xpack.monitoring.enabled: false

# Uncomment to send the metrics to Elasticsearch. Most settings from the
# Elasticsearch output are accepted here as well. Any setting that is not set is
# automatically inherited from the Elasticsearch output configuration, so if you
# have the Elasticsearch output configured, you can simply uncomment the
# following line.
#xpack.monitoring.elasticsearch:
其余都用默认
当FileBeat启动之后,会检测是否有对应的日志文件产生,然后会加载到配置的ES中,
Kibna的配置:
kibana的配置文件在/kibana-6.7.0-linux-x86_64/config/kibana.yml中
如未修改ES的默认地址,可以采用默认配置
总结
使用ES+FileBeat+Kinbna进行分析总体简单,可以在Kinbna中进行简单的分析或者复杂的分析,Kinbna支持多种分析方法,详情见官方链接 :https://www.elastic.co/guide/en/kibana/current/index.html