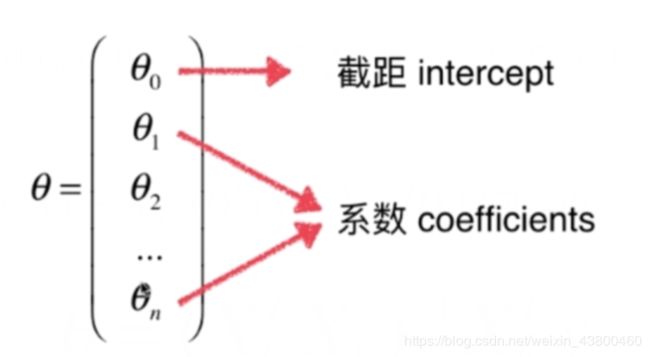
线性回归算法(涉及最小二乘法、梯度下降法)
目录:
一、简单线性回归算法
二、向量化
三、衡量线性回归法的指标MSE、RMS、MAE、R Squared 指标
四,多元线性回归(最小二乘法)
五、多元线性回归(梯度下降法)
一、简单线性回归算法
1、优点:
(1)解决回归问题
(2)思想简单,实现容易
(3)许多强大的非线性模型的基础
(4)结果具有很好的可解释性
(5)蕴含机器学习中的很多重要思想
2、什么是线性回归
(1)寻找一条直线,最大程度地拟合样本特征和样本输出标记之间的关系
(2)样本特征只有一个称为简单线性回归
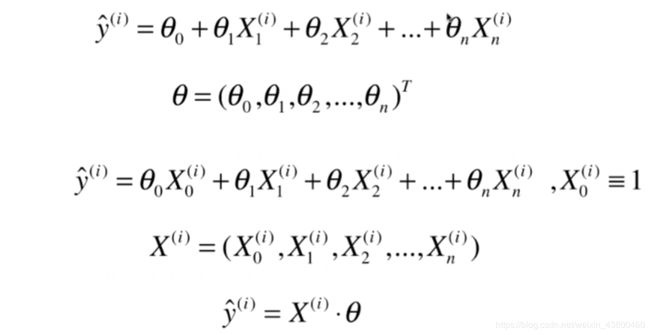
(3)样本特征有多个称为多元线性回归
4、机器学习算法的基本思路
(1)损失函数:度量样本没有拟合的程度
(2)效用函数:度量拟合的程度
(3)通过分析问题,确定问题的损失函数或效用函数;通过最优化损失函数或者效用函数,获得机器学习模型,近乎所有参数学习算法都是这样的套路,如线性回归,SVM,多项式回归,神经网络,逻辑回归…
6、创建SimpleLinearRegression类
import numpy as np
import matplotlib.pyplot as plt

#定义一个类,注意括号是空的,因为我们要从空白创建这个类
class SimpleLinearRegression1():
     def _init_(self):
         #初始化属性a,b。a,b用于储存计算生成的结果,不是用户输入数据
         self.a_=None
         self.b_=None

         #fit方法,x_train,y_train是用户输入数据
     def fit(self,x_train,y_train):
         #根据训练数据集x_train,y_train训练线性回归模型
         assert x_train.ndim==1,\
             "Simple Linear Regressor can only solve single feature training data."
         assert len(x_train)==len(y_train),\
             "the size of x_train must be equal to the size of y_train"

            #计算x,y平均值
         x_mean=np.mean(x_train)
         y_mean=np.mean(y_train)

        #计算a,b的值
         num=0.0
         d=0.0
         for x,y in zip(x_train,y_train):
             num+=(x-x_mean)*(y-y_mean)
             d+=(x-x_mean)**2
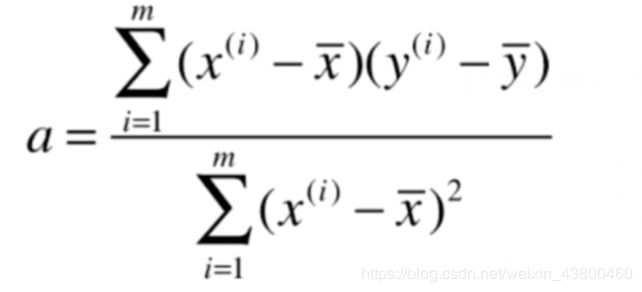
         self.a_=num/d
         self.b_=y_mean-self.a_*x_mean

         return self

     #predict方法
     def predict(self,x_predict):
         #给定待测数据集x_predict,返回表示x_predict的结果向量
         assert x_predict.ndim==1,\
             "Simple Linear Regressor can only solve single feature training data."
         assert self.a_ is not None and self.b_ is not None,\
             "must fit before predict!"

         return np.array([self._predict(x) for x in x_predict])

     #_predict方法
     def _predict(self,x_single):
         #给定待测数据集x_single,返回表示x_single的预测结果值
         return self.a_*x_single+self.b_

     #_repr_方法,字符串输出
     def _repr_(self):
         return"SimpleLinearRegression1()"
7、根据SimpleLinearRegression类创建一个实例
import numpy as np
import matplotlib.pyplot as plt
from SimpleLinearRegression import SimpleLinearRegression1


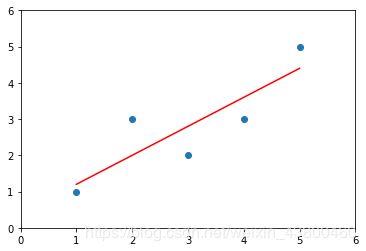
x=np.array([1,2,3,4,5])
y=np.array([1,3,2,3,5])

#创建一个实例
reg1=SimpleLinearRegression1()
reg1.fit(x,y)

x_predict=6
reg1.predict(np.array([x_predict]))

#reg1.a_
#reg1.b_

y_hat=reg1.predict(x)
plt.scatter(x,y)
plt.plot(x,y_hat,color='r')
plt.axis([0,6,0,6])
plt.show()
class SimpleLinearRegression2():
     def _init_(self):
         #初始化属性a,b。a,b用于储存计算生成的结果,不是用户输入数据
         self.a_=None
         self.b_=None

         #fit方法,x_train,y_train是用户输入数据
     def fit(self,x_train,y_train):
         #根据训练数据集x_train,y_train训练线性回归模型
         assert x_train.ndim==1,\
             "Simple Linear Regressor can only solve single feature training data."
         assert len(x_train)==len(y_train),\
             "the size of x_train must be equal to the size of y_train"

            #计算x,y平均值
         x_mean=np.mean(x_train)
         y_mean=np.mean(y_train)

        #向量化计算a,b的值
         num=(x_train-x_mean).dot(y_train-y_mean)
         d=(x_train-x_mean).dot(x_train-x_mean)

         self.a_=num/d
         self.b_=y_mean-self.a_*x_mean

         return self

     #predict方法
     def predict(self,x_predict):
         #给定待测数据集x_predict,返回表示x_predict的结果向量
         assert x_predict.ndim==1,\
             "Simple Linear Regressor can only solve single feature training data."
         assert self.a_ is not None and self.b_ is not None,\
             "must fit before predict!"

         return np.array([self._predict(x) for x in x_predict])

     #_predict方法
     def _predict(self,x_single):
         #给定待测数据集x_single,返回表示x_single的预测结果值
         return self.a_*x_single+self.b_

     #_repr_方法,字符串输出
     def _repr_(self):
         return"SimpleLinearRegression2()"
9、向量化性能测试
import numpy as np
import matplotlib.pyplot as plt
from SimpleLinearRegression import SimpleLinearRegression1
from SimpleLinearRegression import SimpleLinearRegression2

m=1000000
big_x=np.random.random(size=m)
big_y=big_x*2.0+3.0+np.random.normal(size=m)

reg1=SimpleLinearRegression1()
reg2=SimpleLinearRegression2()

%timeit reg1.fit(big_x,big_y)
%timeit reg2.fit(big_x,big_y)
三、衡量线性回归法的指标MSE、RMS、MAE、R Squared 指标
(1)均方误差MXE(存在量纲上的误差):
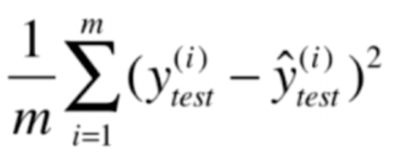
(2)均方根误差RMS:

(3)平均绝对误差MAE:
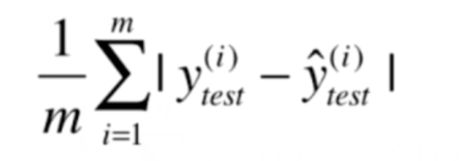
(4)R Squared 指标
(1)

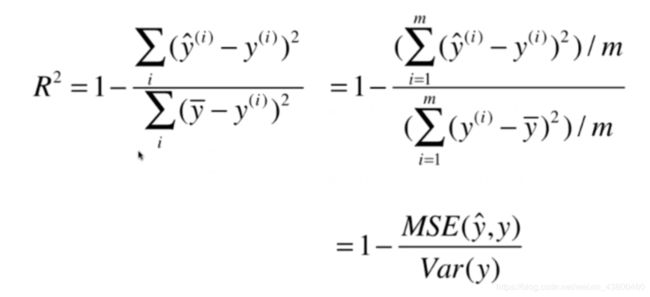
(2)R^2<=1
R2越大越好,当我们的预测模型不犯任何错误是,R2得到最大值为1
当我们的模型等于基准模型时,R^2=0
如果R^2<0,说明我们学习到的模型还不如基准模型,很有可能我们的数据不存在任何线性关系。
2、实现多元线性回归
import numpy as np
import matplotlib.pyplot as plt


#定义一个类,注意括号是空的,因为我们要从空白创建这个类
class LinearRegression():

    def _init_(self):
        #初始化Linear Regression模型
        self.coef_=None
        self.interception_=None
        self._theta=None

    def fit_normal(self,x_train,y_train):
        #根据训练数据集x_train,y_train训练 Linear Regression模型
         assert x_train.shape[0]==y_train.shape[0],\
             "the size of x_train must be equal to the size of y_train"

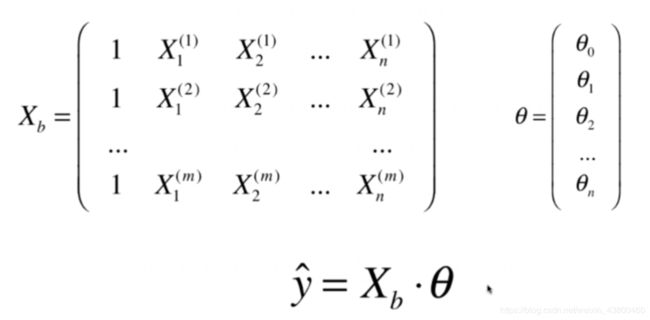
         x_b=np.hatack([np.ones((len(x_train),1)),x_train])
         self._theta=np.linalg.inv(x_b.T.dot(x_b)).dot(x_b.T).dot(y_train);
         self.interception_=self.theta[0]
         self.coef_=self._thta[1:]

         return self

    def predict(self,x_predict):
             #给定待测数据集x_predict,返回表示x_predict的结果向量
        assert self.self.interception_ is not None and self.coef is not None,\
            "must fit before predict!"
        assert x_predict.shape[1]==len(self.coef_),\
            "the feature number of x_predict must be equal to x_train"

        x_b=np.hatack([np.ones((len(x_train),1)),x_predict])
        return x_b.dot(self._theta)


    def _repr_(self):
        return "LinearRegression()"
五、多元线性回归(梯度下降法)
(一)、梯度下降法
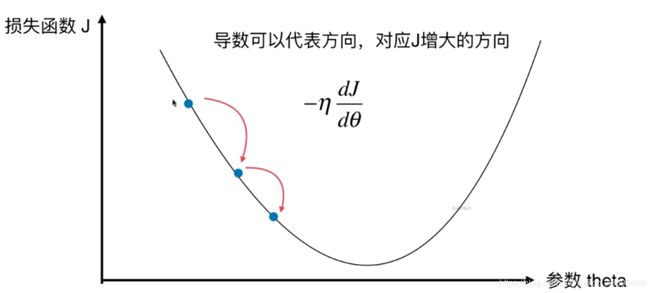
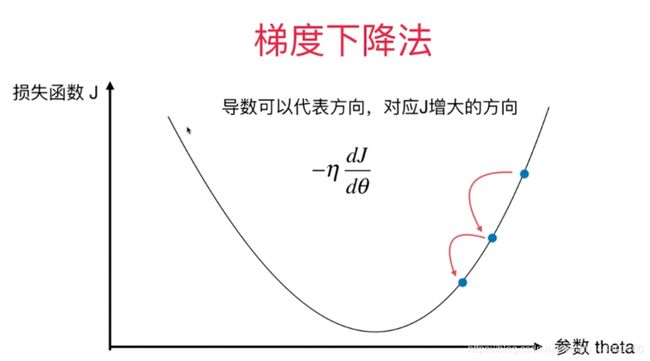
1、特点
(1)不是一个机器学习算法
(2)是一种基于搜索的最优化方法
(3)作用:最小化一个损失函数
(4)梯度上升法:最大化一个效用函数
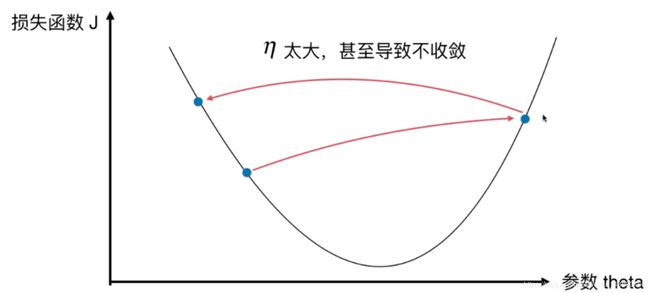
2、学习率
(1)取值影响获得最优解的速度
(2)取值不合适,甚至得不到最优解
(3)是梯度下降法的一个超参数
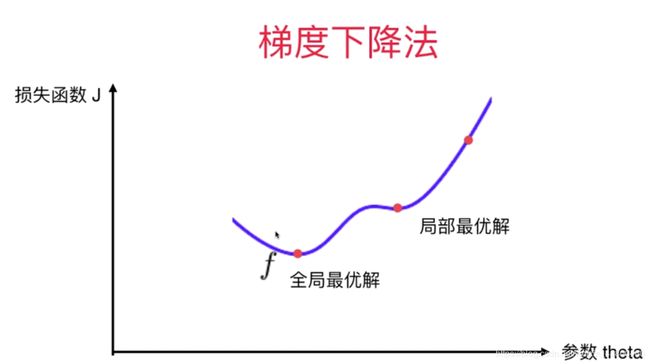
3、并不是所有函数都有唯一的极值点,但是线性回归法的损失函数具有唯一最优解
解决方案:
(1)多次运行,随机化初始点
(2)梯度下降法的初始点也是一个超参数
(二)、多元线性回归的实现
import numpy as np
import matplotlib.pyplot as plt


#定义一个类,注意括号是空的,因为我们要从空白创建这个类
class LinearRegression():

    def _init_(self):
        #初始化Linear Regression模型
        self.coef_=None
        self.interception_=None
        self._theta=None

    def fit_normal(self,x_train,y_train):
        #根据训练数据集x_train,y_train训练 Linear Regression模型
         assert x_train.shape[0]==y_train.shape[0],\
             "the size of x_train must be equal to the size of y_train"

         x_b=np.hatack([np.ones((len(x_train),1)),x_train])
         self._theta=np.linalg.inv(x_b.T.dot(x_b)).dot(x_b.T).dot(y_train);
         self.interception_=self.theta[0]
         self.coef_=self._theta[1:]

         return self


    def fit_gd(self,X_train,y_train,eta=0.01,n_iters=1e4):

        #根据训练数据集x_train,y_train训练 Linear Regression模型
        assert X_train.shape[0]==y_train.shape[0],\
            "the size of x_train must be equal to the size of y_train"

        def J(theta,X_b,y):
            try:
                return np.sum((y-X_b.dot(theta))**2)/ len(y)
            except:
                return float('inf')

        #求J的导数
        def dJ(theta,X_b,y):
            res=np.empty((len(theta)))#开辟一个空间
            res[0]=np.sum(X_b.dot(theta)-y)#第零个元素
            #求1到最后一项的值
            for i in range(1,len(theta)):
                res[i]=(X_b.dot(theta)-y).dot(X_b[:,i])
            return res*2/len(X_b)#返回梯度

        #梯度下降法,n_iters=1e4用以防止死循环,epsilon=1e-8用以表示精度
        def gradient_descent (X_b,y,initial_theta,eta,n_iters=1e4,epsilon=1e-8):
            theta=initial_theta
            cur_iter=0

            while cur_iter<n_iters:
                gradient=dJ(theta,X_b,y)
                last_theta=theta
                theta=theta-eta*gradient
                if(abs(J(theta,X_b,y,)-J(last_theta,X_b,y,))<epsilon):
                   break

                cur_iter+=1

            return  theta
        X_b=np.hstack([np.ones((len(X_train),1)),X_train])
        initial_theta=np.zeros(X_b.shape[1])#初始化theta,theta是一个向量
        self._theta=gradient_descent (X_b,y_train,initial_theta,eta,n_iters)
        self.intercept_=self._theta[0]
        self.coef_=self._theta[1:]
        return self


    def predict(self,x_predict):
             #给定待测数据集x_predict,返回表示x_predict的结果向量
        assert self.interception_ is not None and self.coef is not None,\
            "must fit before predict!"
        assert x_predict.shape[1]==len(self.coef_),\
            "the feature number of x_predict must be equal to x_train"

        x_b=np.hatack([np.ones((len(x_predict),1)),x_predict])
        return x_b.dot(self._theta)


    def _repr_(self):
        return "LinearRegression()"
(三)、创建一个多元线性回归实例
import numpy as np
import matplotlib.pyplot as plt

from LinearRegression import LinearRegression


np.random.seed(666)#设置种子,使具有可重复性
x=2*np.random.random(size=100)#x是一维向量
y=x*3.+4.+np.random.normal(size=100)
X=x.reshape(100,1)#100行1列数据

lin_reg=LinearRegression()
lin_reg.fit_gd(X,y)
学习视频链接:http://www.bilibili.com/video/av37823773?p=1&share_medium=android&share_source=qq&bbid=XY6BEEE61E1082EABBEE1D8AC8BE9CD4145DC&ts=1553912854117.


