Python数据分析之智联招聘职位分析完整项目(数据爬取,数据分析,数据可视化)
作者找工作中
开发环境
4.3【开发平台及环境】
Windons 10 教育版
Python 3.7
IntelliJ IDEA 2018.2.1 / PyCharm
Googe Chrome
数据清洗 分析模块pandas,numpy
可视化模块pyecharts
下期更新flask可项目视化项目
python,MySQL,Echarts,js
一:数据采集
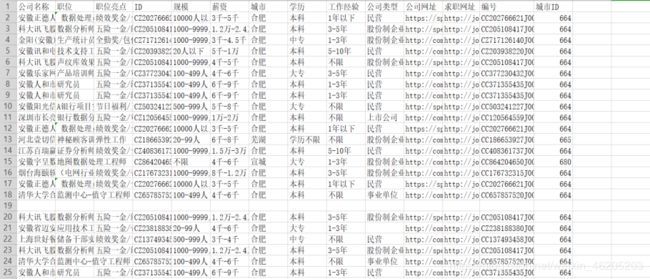
招聘信息采集:使用爬虫采集技术,采集字段如下:
公司名称,职位,职位亮点,ID,规模,城市,学历,工作经验,公司类型,公司网站,求职网址,编号,城市ID
项目开发时间2019-10-10到10-16期间,爬虫代码随时间变化可能无效
import requests
from lxml import etree
import re
import json
import csv
import time
header = {
    'Accept': 'application/json, text/plain, */*',
    'User-Agent': 'Mozilla/5.0 (Windows NT 10.0; WOW64) AppleWebKit/537.36 (KHTML, like Gecko) Chrome/70.0.3538.25 Safari/537.36 Core/1.70.3732.400 QQBrowser/10.5.3819.400',
    "cookie":"x-zp-client-id=e2f8492a-39c6-44f1-f181-3408dfc4c651; urlfrom2=121114583; adfcid2=www.baidu.com; adfbid2=0; sts_deviceid=1"
             "6d66515ef32a9-00a0ecf38d6864-34564a75-2073600-16d66515ef5900; sou_experiment=capi; sensorsdata2015jssdkcross=%7B%22distin"
             "ct_id%22%3A%2216d66515f058fe-0a7bf2d03b44ab-34564a75-2073600-16d66515f062a6%22%2C%22%24device_id%22%3A%2216d66515f058fe-0a7"
             "bf2d03b44ab-34564a75-2073600-16d66515f062a6%22%2C%22props%22%3A%7B%22%24latest_traffic_source_type%22%3A%22%E7%9B%B4%E6%8E"
             "%A5%E6%B5%81%E9%87%8F%22%2C%22%24latest_referrer%22%3A%22%22%2C%22%24latest_referrer_host%22%3A%22%22%2C%22%24latest_search"
             "_keyword%22%3A%22%E6%9C%AA%E5%8F%96%E5%88%B0%E5%80%BC_%E7%9B%B4%E6%8E%A5%E6%89%93%E5%BC%80%22%7D%7D; acw_tc=276082061571053"
             "5124757507e7f855599045d70c3a3baead7cb13244f9ce1; dywea=95841923.3929760379540693000.1569379672.1569379672.1571054618.2; dywez"
             "=95841923.1571054618.2.2.dywecsr=jobs.zhaopin.com|dyweccn=(referral)|dywecmd=referral|dywectr=undefined|dywecct=/cc224037312"
             "j00240379404.htm; Hm_lvt_38ba284938d5eddca645bb5e02a02006=1569379672,1571054618; __utma=269921210.106900723.1569379672.156937"
             "9672.1571054618.2; __utmz=269921210.1571054618.2.2.utmcsr=jobs.zhaopin.com|utmccn=(referral)|utmcmd=referral|utmcct=/CC2240373"
             "12J00240379404.htm; LastCity%5Fid=749; ZP_OLD_FLAG=false; POSSPORTLOGIN=0; CANCELALL=0; LastCity=%E9%95%BF%E6%A0%AA%E6%BD%AD; "
             "sts_sg=1; sts_chnlsid=Unknown; zp_src_url=http%3A%2F%2Fjobs.zhaopin.com%2FCC879864350J00334868004.htm; jobRiskWarning=true; acw"
             "_sc__v2=5da57cb5b3223856c3fb768be55c39bec99b9b33; ZL_REPORT_GLOBAL={%22jobs%22:{%22recommandActionidShare%22:%22f4ec2b1a-bbe2-41"
             "ba-b0fc-14c426ffd63b-job%22%2C%22funczoneShare%22:%22dtl_best_for_you%22}}; sts_sid=16dce6f31656d-0cee0282bd8b1b-34564a75-2073600-16dce6f31666cf; sts_evtseq=2"
}
def get_context(number):
    url = "https://fe-api.zhaopin.com/c/i/similar-positions?number="+number
    urll='https://jobs.zhaopin.com/'+number+'.htm'
    html = requests.get(url=url, headers=header)
    # print(html.json()['data']['data']['list'])
    companyName,companyNumber,companySize,salary60,workCity,education,\
    workingExp,property,companyUrl,positionURL,name,welfareLabel,number,cityId,cityDistrict,applyType,score,tag="","","","","","","","","","","","","","","","","",""
    try:
        for i in html.json()['data']['data']['list']:
            companyName = i['companyName']  # 公司
            companyNumber = i['companyNumber']  # ID
            companySize = i['companySize']  # 规模
            salary60 = i['salary60']  # 薪水
            workCity = i['workCity']  # 城市
            education = i['education']  # 学历
            workingExp = i['workingExp']  # 工作经验
            property = i['property']  #企业性质
            companyUrl = i['companyUrl']  # 公司网址
            positionURL = i['positionURL']  # 求职网址
            name = i['name']  # 职位名称
            # welfareLabel = i['welfareLabel']  # 福利
            number = i['number']  # 编号
            cityId = i['cityId']  # 城市id
            cityDistrict = i['cityDistrict']  # 城市区域
            applyType = i['applyType']  # 公司类型
            score = i['score']  # 公司分数
            tag=[] #标签

            for j in i['welfareLabel']:
                tag.append(j['value'])
            tag="/".join(tag)
    except:
        pass

    html = requests.get(url=urll,headers=header)
    html_xpath = etree.HTML(html.text)
# miaosu = re.findall('(.*?)采集的数据保存为csv格式
关于python访问MySQL数据,使用matplotlib(复杂)可视化的简单例子访问:点击查看项目
简介:众多的招聘岗位中,大数据岗位分布在全国各个城市,岗位与企业之间又有着错综复杂的联系,企业类型多样,不同的企业有着各自不同的文化,对应聘者也有着不同约束。应聘者不同经验获得的薪资也不一样,找到符合自己的职位,需要考虑招聘者发布的基本要求,如:经验,学历等各方面的需求。应聘者也会考查企业性质和类型。以下我们对发布求职公司进行分析。
大数据岗位基本分析
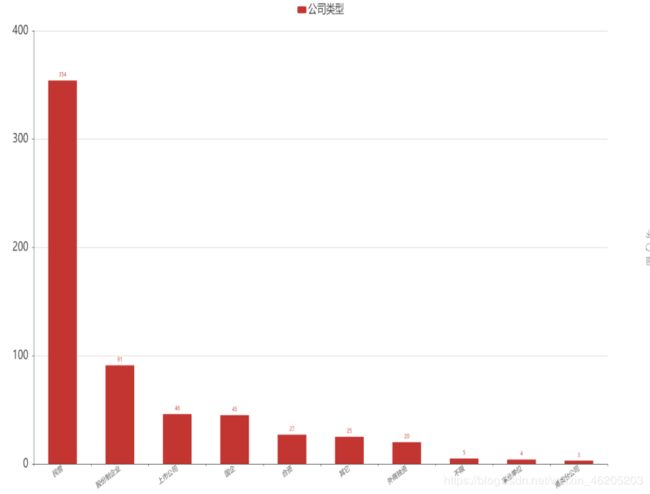
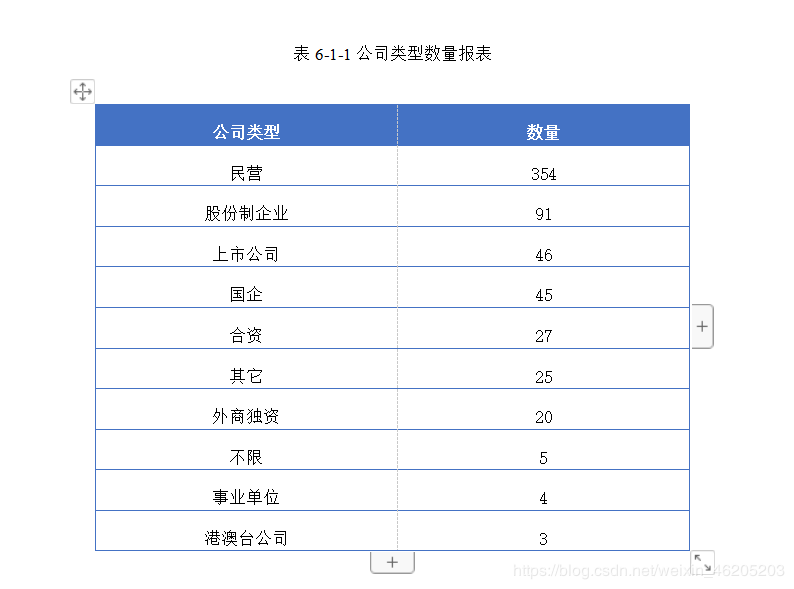
1 统计出公司类型的数量
数据量不大,为了节省开发时间,使用了pandas,可视化使用的是pyecharts,也可以使用将数据导入MySQL,可视化使用 Echarts,后端我常使用flask / node.js,选其一即可,下一个项目介绍flask为依托的可视化项目
# 公司类型的数量
import pandas as pd
from pyecharts import Bar, Pie

# # 显示所有列
# pd.set_option('display.max_columns', None)
# # 显示所有行
# pd.set_option('display.max_rows', None)
# # 设置value的显示长度为100,默认为50
# pd.set_option('max_colwidth', 100)

# 引擎,去空(只有有一个字段为空就删除整行数据),根据ID字段去重,保留第一个
data = pd.read_csv('../File/智联招聘_数据分析师.csv',engine='python').dropna().drop_duplicates('ID','first')


# 分组,求数量,排序(倒叙),

# conpany = data[['ID','公司类型']].groupby(by='公司类型',as_index=False).count()

company = data[['ID','公司类型']].groupby(by='公司类型',as_index=False).count().sort_index(by='ID',ascending=False)

# company.to_csv('text.csv')

bar = Bar(width=2000, height=1000)
bar.add("公司类型", company['公司类型'], company['ID'],
        bar_category_gap="50%",  # 柱状大小减少一半
        is_label_show=True,  # 显示柱子值
        xaxis_label_textsize=15,  # x轴 柱子text的大小
        yaxis_label_textsize=25,  #y轴
        xaxis_rotate=30,        #x轴字体旋转
        legend_text_size=25
        )   #title大小
bar.render("2.1公司类型的数量.html")
# #
pie = Pie(height=850, width=1800)
pie.add("公司类型", company['公司类型'], company['公司名称'],
        is_label_show=True)
pie.render("2.1公司类型的数量占比.html")
分析:
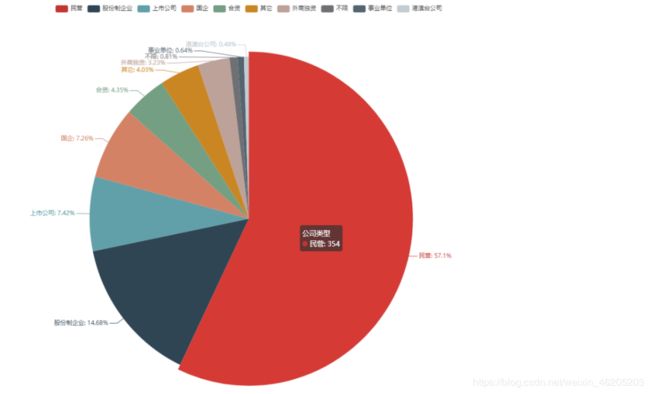
在数量前10的公司类型中,民营类型稳居榜首,占总体比例57%。民营企业在我国已经经历了20多年的发展和改革,民营经济已经克服了先天性不足和自身基础薄弱等劣势,已经成为了我国国民经济的重要组成部分。
股份制企业榜二,占总体比例14.68%。股份制企业最早诞生在欧洲国家,是企业为了征集民间参与企业发展的一种战略,发行股票,一方借以取得股息,另一方面又能让人们参与企业经营和管理。
上市公司榜三,占比7.42%。在美国500家大企业有96%是上市公司,是一种公开发行股票需要经过国务院或者国务院授权的一种公司,上市公司可以在证券交易所自由交易个人股份的以一种公司。
国企,合资企业等其他类型的公司在招聘中并不是很突出,在另外一面也可以反应对大数据岗位需求不多,国企,合资企业发展相对稳定,成熟,普遍不属于互联网企业。
小结:
根据上述分析,我们可以了解,大数据分析师岗位,民营企业,股份制企业招聘数量相对较多,国家鼓励大众创业,创新,推动国民经济发展,IT互联网企业更多的是属于创新类企业,新型企业。国企,合资企业成熟,但是却没有引入太多互联网大数据技术。在面向求职这一方向,IT大数据分析师应该更多的考虑民营企业和股份制企业。
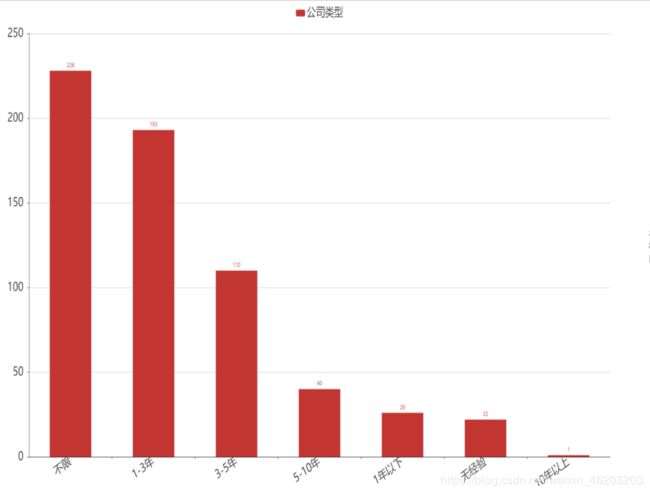
统计大数据职位经验要求的数量
同理上述
data = pd.read_csv('../File/智联招聘_数据分析师.csv',engine='python').dropna().drop_duplicates('ID',inplace=False)
undergo = data[['职位','工作经验']]\
        .groupby('工作经验',as_index=False)\
        .count()\
        .sort_index(by='职位',ascending=False)
分析:
大数据岗位工作要求类数量最多的是“不限”,其次是1-3年,3-5年相比榜一,榜二已减少一般,由此我们可以看出,大数据岗位属于新兴职业,求贤若渴,“不限”岗位最多,比较java开发岗位经验要求,我们可以从侧面反应企业对招聘大数据岗位降低了要求。
小结:
根据上述Java开发,python开发和大数据分析师,三个职业对比,我们可以看到IT互联网岗位要求各不相同,我国IT互联网公司多岗位一直处于空缺,尤其是新兴职业,大数据,云计算,人工智能,才人严重匮乏。
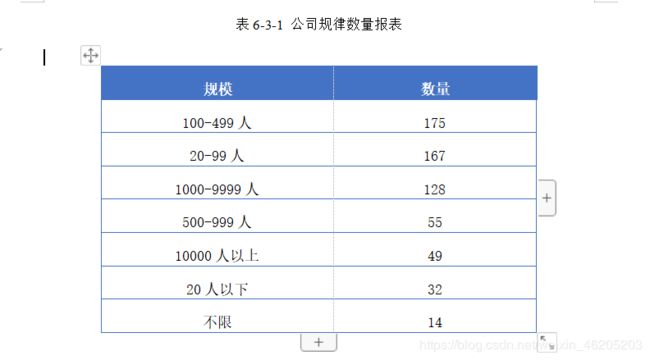
统计企业规模及企业数量
# 3.统计出公司规模及数量
import pandas as pd
from pyecharts import Bar

# 引擎,去空(只有有一个字段为空就删除整行数据),根据ID字段去重,保留第一个
data = pd.read_csv('../File/智联招聘_数据分析师.csv', engine='python').dropna()
data.drop_duplicates('ID', 'first', inplace=False)
company = data[['城市ID', '规模']].groupby('规模', as_index=False).count()
company = company.sort_index(by='城市ID', ascending=False)
company.to_csv('text2.csv')
# # 柱状大小减少一半, 显示柱子值,x轴 柱子text的大小,y轴,x轴字体旋转,title大小
bar = Bar(width=2000, height=1000)
bar.add("公司规模", company['规模'], company['城市ID'],
        bar_category_gap="50%",
        is_label_show=True,
        xaxis_label_textsize=15,
        yaxis_label_textsize=25,
        xaxis_rotate=30,
        legend_text_size=25)
bar.render("2.3公司规模及数量.html")
分析:
在数量前10的公司规律中,100-499类型稳居榜首。IT互联网公司人员招聘大数据就岗位的也基本稳定在这个层级。
榜二20-99人,数据在某方面可能存在一定的争议性。招聘公司五花八门,类型繁多,有培训机构,有猎头公司,有数据外包等小型公司等等一些小规模创业公司。
榜三1000-9999人,属于中大型企业。
小结:
根据上述分析,我们得到一个信息,招聘大数据岗位的IT互联网企业人数规模适中,大中小企业都有对大数据分析师招聘。在某一方面也反映了大数据岗位受到了大中小企业的追捧。
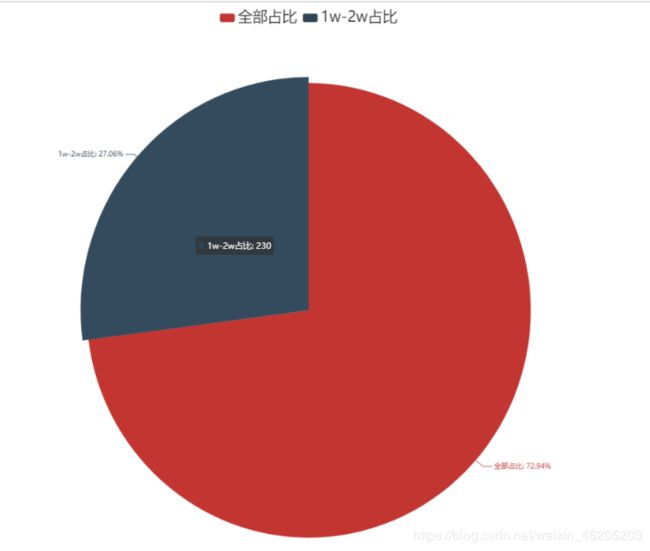
统计全国招聘大数据职位薪资1w到2w的企业占总体的百分比
# 1w到2w高薪的公司在总体数据的百分百
import pandas as pd
from pyecharts import Pie

# 显示所有列
pd.set_option('display.max_columns', None)
# 显示所有行
pd.set_option('display.max_rows', None)
# 设置value的显示长度为100,默认为50
pd.set_option('max_colwidth', 100)

data = pd.read_csv('../File/智联招聘_数据分析师.csv',engine='python').dropna().drop_duplicates('ID','first',inplace=False)
money = data[['公司名称','薪资']]
money_sum_number = data[['公司名称','薪资']].groupby('薪资',as_index=False).count()
money_sum_number = money_sum_number['公司名称'].sum()
# #将数据分割(8千-1.4万)分成起薪8千,最高薪1.4万,最后我们只取最高薪
first_money = money['薪资'].str.split('-').str[0].dropna()
last_money= money['薪资'].str.split('-').str[1].dropna()

# #将他转类型,不然不能用contains()函数
a = pd.DataFrame(last_money)
# #这是包含了 8千 和 2.5w,所以我们要匹配含有万的,能去掉8千,2.5W的不能
money_1w_n = a[a['薪资'].str.contains('万')]['薪资']
# print(money_1w_n)
money_1_2w_num = []
#将数组循环,replace将“万”替换掉,再转float类型,匹配<=2万的,存入数组money_1w_2w
[money_1_2w_num.append(float(j.replace('万', ''))) for j in money_1w_n if float(j.replace('万', '')) <=2]
print(money_1_2w_num)


data_money_pie = []
data_money_pie.append(float(money_sum_number))
data_money_pie.append(float(len(money_1_2w_num)))
x = ['全部占比','1w-2w占比']
print(data_money_pie)
# pie = Pie("全国天气类型比例", '2018-4-16')
pie = Pie(width=2000,height=1000)
pie.add("",x,data_money_pie,
        is_label_show=True,
        legend_text_size=25,)
pie.render("2.4统计薪资1w-2w的占比.html")
分析:
本次计算的薪资是平均薪资,我们根据薪资分布统计出平均薪资,大数据分析师1w - 2w薪资占比27.06%,数量230,总职位:620.0(后面我们分析了不同经验的平均薪资,和不同学历的平均薪资等等)
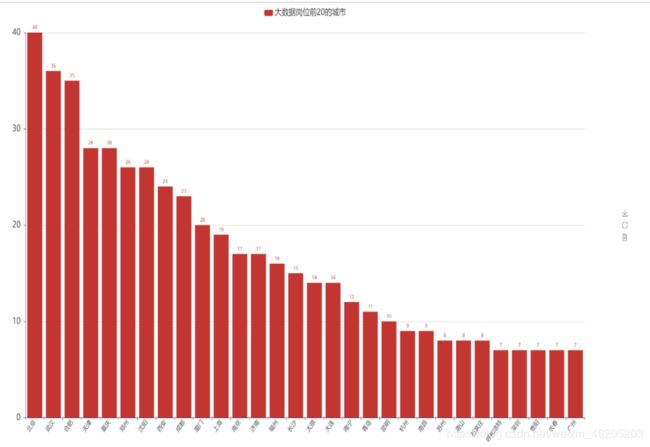
统计全国大数据职位数量,即在哪些城市容易找到大数据职位
# 1.分析不同城市对于大数据岗位的需求,即在该城市是否容易找到大数据的岗位,求出不同城市“bigdata”的数量(需求量)
import pandas as pd
from pyecharts import Bar,WordCloud
data = pd.read_csv('../File/智联招聘_数据分析师.csv',engine='python').dropna().drop_duplicates('ID',inplace=False)
city_bigdata = data[['职位','城市']].groupby('城市',as_index=False).count().sort_index(by='职位',ascending=False)[:30]
city_word = data[['职位','城市']].groupby('城市',as_index=False).count().sort_index(by='职位',ascending=False)
# city_bigdata.to_csv('text3.csv')
bar = Bar(width=2000,height=1000)
bar.add("大数据岗位前20的城市",city_bigdata["城市"],city_bigdata["职位"],
        is_label_show=True,
        xaxis_label_textsize=15,
        yaxis_label_textsize=20,
        xaxis_rotate=50,
        legend_text_size=20)
bar.render('3.1各城市岗位需求柱状图.html')

word = WordCloud(width=2000,height=1000)
word.add("前10岗位",city_word["城市"],city_word["职位"])
word.render('3.1前10岗位词云图.html')
# print(list(city_bigdata['城市']))
分析:
在数量前15的城市中,北京稳居榜首,数据展示了城市与大数据岗位分布情况,给应聘者提供方向。
北京,互联网公司总部所在地,在北京市有近50家大型互联网公司,稳居全国榜一,北京互联网公司占据了全国半边江山,也可以看出北京的综合实力。分析:
在数量前15的城市中,北京稳居榜首,数据展示了城市与大数据岗位分布情况,给应聘者提供方向。
北京,互联网公司总部所在地,在北京市有近50家大型互联网公司,稳居全国榜一,北京互联网公司占据了全国半边江山,也可以看出北京的综合实力。
统计全国各大数据职位薪资分布情况
# 1.分析不同城市对于大数据岗位的需求,即在该城市是否容易找到大数据的岗位,求出不同城市“bigdata”的数量(需求量)
import pandas as pd
from pyecharts import Bar,WordCloud
data = pd.read_csv('../File/智联招聘_数据分析师.csv',engine='python').dropna().drop_duplicates('ID',inplace=False)
city_bigdata = data[['职位','城市']].groupby('城市',as_index=False).count().sort_index(by='职位',ascending=False)[:30]
city_word = data[['职位','城市']].groupby('城市',as_index=False).count().sort_index(by='职位',ascending=False)
# city_bigdata.to_csv('text3.csv')
bar = Bar(width=2000,height=1000)
bar.add("大数据岗位前20的城市",city_bigdata["城市"],city_bigdata["职位"],
        is_label_show=True,
        xaxis_label_textsize=15,
        yaxis_label_textsize=20,
        xaxis_rotate=50,
        legend_text_size=20)
bar.render('3.1各城市岗位需求柱状图.html')

word = WordCloud(width=2000,height=1000)
word.add("前10岗位",city_word["城市"],city_word["职位"])
word.render('3.1前10岗位词云图.html')
# print(list(city_bigdata['城市']))
分析:
在数量前15的城市中,北京稳居榜首,数据展示了城市与大数据岗位分布情况,给应聘者提供方向。
北京,互联网公司总部所在地,在北京市有近50家大型互联网公司,稳居全国榜一,北京互联网公司占据了全国半边江山,也可以看出北京的综合实力。
统计全国各大数据职位薪资分布情况
注意:数据清洗涉及到了一个中文薪资问题,
格式如下:
5千-8千 ,7千-1.4万,面议,1万-2万,1.2万-2.4万 …等
我们需要分析的是全国各省的薪资分布情况(细品)
1.数据清洗,将薪资转成float
2.将面议等清洗掉或者缺失值填充
3.求出各省的The average salary
# 不同城市的大数据岗位薪资的分布
import pandas as pd
import numpy as np
from pyecharts import Bar, WordCloud, Line

pd.set_option('display.max_columns', None)
# 显示所有行
pd.set_option('display.max_rows', None)
# 设置value的显示长度为100,默认为50
pd.set_option('max_colwidth', 100)

data = pd.read_csv('../File/智联招聘_Java开发.csv', engine='python').dropna().drop_duplicates('ID', 'first', inplace=False)
city_bigdata = data[['职位', '城市', '薪资']]
print(city_bigdata)
def price_str(x):
    # index key_0 薪资_x 薪资_y  x  y 字段名,x带表当前行,可以通过下标进行索引
    if (x['x'] > 0):
        x['薪资_x'] = float(x['薪资_x'][:x['x']]) * 10000
    if (x['x'] < 0):
        x['薪资_x'] = float(x['薪资_x'][:x['x']]) * 1000

    if (x['y'] > 0):
        x['薪资_y'] = float(x['薪资_y'][:x['y']]) * 10000
    if (x['y'] < 0):
        x['薪资_y'] = float(x['薪资_y'][:x['y']]) * 1000
    return x

first_qian = pd.DataFrame(city_bigdata['薪资'].str.split('-').str[0])
last_qian = pd.DataFrame(city_bigdata['薪资'].str.split('-').str[1])
# 很多“面议”岗位,前面split之后分成了“面议”和“NaN”,不容易发现,使用numpy.nan获取NaN将他替换
first_qian = pd.DataFrame(first_qian['薪资'].replace('面议', '1千'))
last_qian = pd.DataFrame(last_qian['薪资'].replace(np.nan, '1千'))

a = pd.merge(first_qian, last_qian, on=first_qian.index)
# a.字段名,类型,寻找 “万”
a['x'] = a.薪资_x.str.find('万')
a['y'] = a.薪资_y.str.find('万')
city_price = a.apply(price_str, axis=1)
# 删除 x  y  key_0 字段,按照列
city_price = city_price.drop(['x', 'y', 'key_0'], axis=1)

# sum  = city_price.eval('薪资_x+薪资_y',inplace=True)
# 两列求出平均值
city_price['薪资'] = city_price.mean(axis=1)
print(city_price)
city = data[['职位', '城市']]
city = city.reset_index(drop=True)
city_price_avg = pd.merge(city, city_price, on=city.index).drop(['key_0'], axis=1)
city_price_avg_word = city_price_avg.groupby('城市', as_index=False).mean().sort_index(by='薪资', ascending=False)
city_price_avg_line_bar = city_price_avg.groupby('城市', as_index=False).mean().sort_index(by='薪资', ascending=False)[:10]
city_price_avg_line_bar.to_csv("text4.csv")
可视化
作者为什么做两个图?
作者的回应是:‘多做又不要你的钱,还能更充分的表达数据的意思’
word = WordCloud(width=1500, height=700)
word.add("", city_price_avg_word['城市'], city_price_avg_word['薪资'], word_size_range=[30, 100], )
word.show_config()
word.render("3.2城市薪资词云图.html")

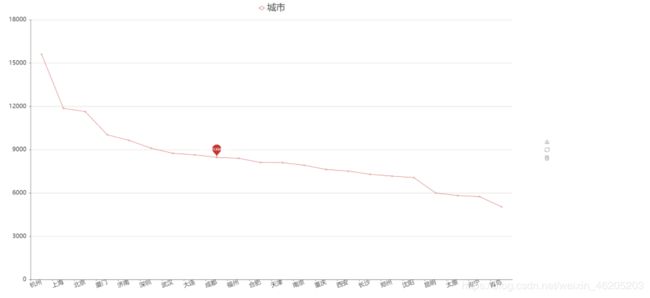
line = Line(width=2000, height=1000)
line.add("城市", city_price_avg_line_bar['城市'], city_price_avg_line_bar['薪资'],
         is_label_show=True,
         xaxis_rotate=20,
         xaxis_label_textsize=20,
         legend_text_size=30,
         yaxis_label_textsize=20,
         is_smooth=True,
         mark_point=['average'])
line.render("3.2各城市平均薪资分布曲线.html")

bar = Bar(width=2000, height=1000)
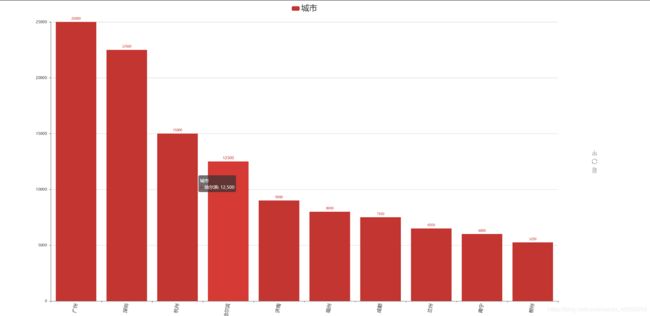
bar.add('城市', city_price_avg_line_bar['城市'], city_price_avg_line_bar['薪资'],
        xaxis_rotate=80,
        is_label_show=True,
        xaxis_label_textsize=15,
        label_text_size=10,
        legend_text_size=25)
bar.show_config()
bar.render("3.2各城市大数据平均薪资柱状图.html")
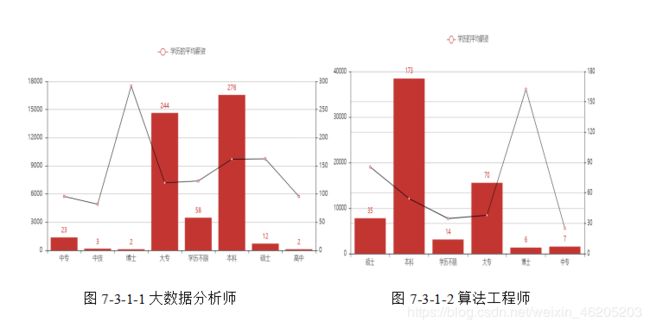
分析“大数据分析师和算法工程师”不同学历数量与平均薪资分布曲线情况
# 不同学历的平均薪资#
import pandas as pd
import numpy as np
from pyecharts import Bar, Pie, WordCloud, Line,Overlap

pd.set_option('display.max_columns', None)
# 显示所有行
pd.set_option('display.max_rows', None)
# 设置value的显示长度为100,默认为50
pd.set_option('max_colwidth', 100)
# 算法工程师
data = pd.read_csv('../File/智联招聘_数据分析师.csv', engine='python').dropna().drop_duplicates('ID', inplace=False)
education_text = data[['学历', '薪资']]

education_text['起薪'] = education_text['薪资'].str.split('-').str[0].replace('面议', '1千')
education_text['尾薪'] = education_text['薪资'].str.split('-').str[1].replace(np.nan, '1千')
education_text = education_text.drop(['薪资'], axis=1)
def price_str(x):
    if x['x'] > 0:
        x['x'] = float(x['起薪'][:x['x']]) * 10000
    if x['x'] < 0:
        x['x'] = float(x['起薪'][:x['x']]) * 1000

    if x['y'] > 0:
        x['y'] = float(x['尾薪'][:x['y']]) * 10000
    if x['y'] < 0:
        x['y'] = float(x['尾薪'][:x['y']]) * 1000
    return x


education_text['x'] = education_text.起薪.str.find('万')
education_text['y'] = education_text.尾薪.str.find('万')
education_text = education_text.apply(price_str, axis=1)
education_text = education_text.drop(['起薪', '尾薪'], axis=1)
education_text['avg_price'] = education_text[['x', 'y']].mean(axis=1)
education_text = education_text.drop(['x', 'y'], axis=1)
education_price = education_text[['学历', 'avg_price']].groupby('学历', as_index=False).mean().sort_index(by='学历',ascending=False)
xueli = education_text[['学历', 'avg_price']].groupby('学历', as_index=False).count().sort_index(by='学历',ascending=False)
# education_price.to_csv("text55.csv")
统计职位不同经验薪资分布情况
import pandas as pd
import numpy as np
from pyecharts import Bar, Pie, WordCloud, Line,Overlap

pd.set_option('display.max_columns', None)
# 显示所有行
pd.set_option('display.max_rows', None)
# 设置value的显示长度为100,默认为50
pd.set_option('max_colwidth', 100)

data = pd.read_csv('../File/智联招聘_数据分析师.csv', engine='python').dropna().drop_duplicates('ID', inplace=False)
education_text = data[['职位','工作经验', '薪资']]

education_text['起薪'] = education_text['薪资'].str.split('-').str[0].replace('面议', '1千')
education_text['尾薪'] = education_text['薪资'].str.split('-').str[1].replace(np.nan, '1千')
education_text = education_text.drop(['薪资'], axis=1)


def price_str(x):
    if x['x'] > 0:
        x['x'] = float(x['起薪'][:x['x']]) * 10000
    if x['x'] < 0:
        x['x'] = float(x['起薪'][:x['x']]) * 1000

    if x['y'] > 0:
        x['y'] = float(x['尾薪'][:x['y']]) * 10000
    if x['y'] < 0:
        x['y'] = float(x['尾薪'][:x['y']]) * 1000
    return x


education_text['x'] = education_text.起薪.str.find('万')
education_text['y'] = education_text.尾薪.str.find('万')
education_text = education_text.apply(price_str, axis=1)
education_text = education_text.drop(['起薪', '尾薪'], axis=1)
education_text['avg_price'] = education_text[['x', 'y']].mean(axis=1)
education_text = education_text.drop(['x', 'y'], axis=1)
education_price = education_text[['工作经验', 'avg_price']].groupby('工作经验', as_index=False).mean()
undergo = education_text[['职位','工作经验']].groupby('工作经验',as_index=False).count()

# 可视化  折线图   柱状图
# education_price.to_csv('text6.csv')
line = Line(height=850, width=1800)
line.add("工作经验的平均薪资", education_price['工作经验'], education_price['avg_price'],line_color='black')

bar = Bar(height=850, width=1800)
bar.add("工作经验的平均薪资", undergo['工作经验'], undergo['职位'],is_label_show=True)

over = Overlap()
over.add(line)
over.add(bar,yaxis_index=1,is_add_yaxis=True)
over.render("3.4不同工作经验的数量于平均薪资子图.html")
print(undergo)
print(education_price)
大数据职位描述要求分析
使用结巴分词模块将bigdata文件中的“岗位描述.csv”进行分词,清洗出“岗位描述”中涉及到的关键技术名称,并将技术名称进行词频统计
使用结巴分词技术,结果保存为csv
#使用分词技术对 “职位描述” 进行分词,提取关键  技术名词 #
import pandas as pd
import jieba
data = pd.read_csv('../File/大数据全国职位_描述.csv',engine='python')
#DataFrom转array
data = data[['职位描述']].values
#结巴分词
text = []
for i in data:
    text.append(i[0])
jieba_text = jieba.cut(str(text),cut_all=True)
a = list(jieba_text)

#过滤中文,保留技术名词
declare = []
for i in a:
    if  (i.islower()==True) | (i.istitle()==True):
        declare.append(i)
#文件操作
text = pd.DataFrame(declare,columns=['name'])
text =text.to_csv("技术名词.csv")
读取分词好的csv文件
import jieba
import pandas as pd
from pyecharts import WordCloud, Bar

data = pd.read_csv('技术名词.csv', engine='python')
data = data[['index', 'name']].groupby('name', as_index=False).count().sort_index(by='index', ascending=False)
data['name'] = [i.lower() for i in data['name']]
data_bar = data[['name', 'index']].groupby(['name'], as_index=False).sum().sort_index(by='index', ascending=False)[:20]
data_word = data[['name', 'index']].groupby(['name'], as_index=False).sum().sort_index(by='index', ascending=False)
print(data)
# 可视化展示  词云图和柱状图
work = WordCloud(height=850, width=1800)
work.add("大数据岗位技术名词统计", data_word['name'], data_word['index'], word_size_range=[20, 100])
work.render('4.1大数据岗位技术名词统计词云图.html')

bar = Bar(width=2000, height=1000)
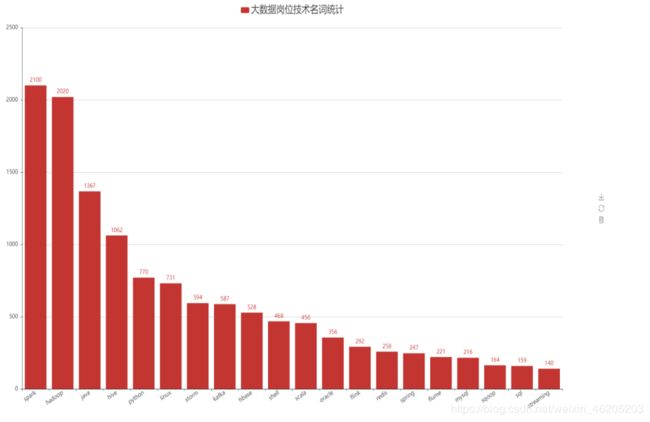
bar.add('大数据岗位技术名词统计', data_bar['name'], data_bar['index'], xaxis_rotate=30, is_label_show=True,
        xaxis_label_textsize=15,yaxis_label_textsize=15, label_text_size=15, legend_text_size=25)
bar.render("4.1大数据岗位技术名词统计柱状图.html")

data_bar.to_csv('text7.csv')
结论:
结合上述数据显示,大数据分析师岗位资历越长,薪资越高。
综合上述数据可得,大数据分析师岗位入职基本信息。
普遍学历门槛为大专和本科,工作经验1-5年发展空间较大,5-10年为瓶颈期。
工作城市北京,广东,深圳,武汉,合肥,天津,重庆,郑州,沈阳,西安,成都,厦门,上海,南京,济南等一二线大型城市。
公司类型民营,股份制企业较多。
公司规模为小型,中大型互联网公司。
发展倾向:
专科,本科工作经验有3-5年,平均薪资12k以上
专科,本科工作经验有1-3年,平均薪资7k- 10k上下
专科,本科工作经验1年以下平均薪资在6K以下。
工作城市的选择也很重要,结合报表5 城市岗位数量及平均薪资报表,可得,杭州,广东,深圳属于高薪多岗位城市,北京,厦门,上海,济南是最理想的就业城市之一。
大数据分析师各大企业招聘所需要的技术为spark,hadoop,Java,hive,python ,linux,storm,kafka,bhase,shell等技术。
喜欢的话点赞转载加收藏
