python 常见绘图总结(更新ing)
目录
1、matplotlib库
2、opencv库
3、参考资料
1、matplotlib库
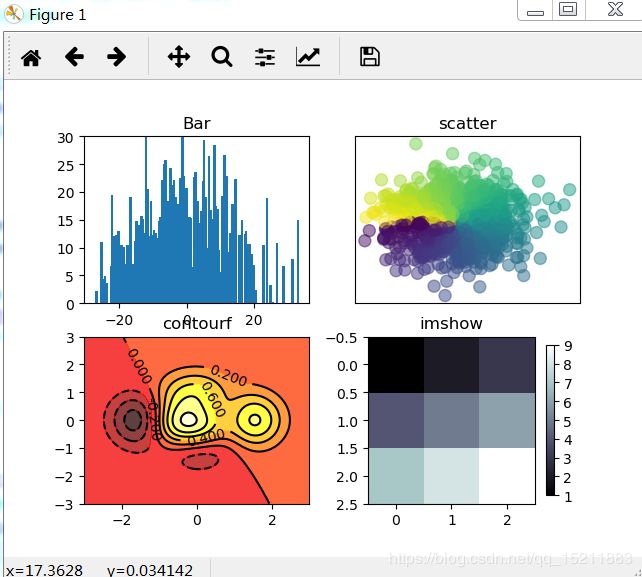
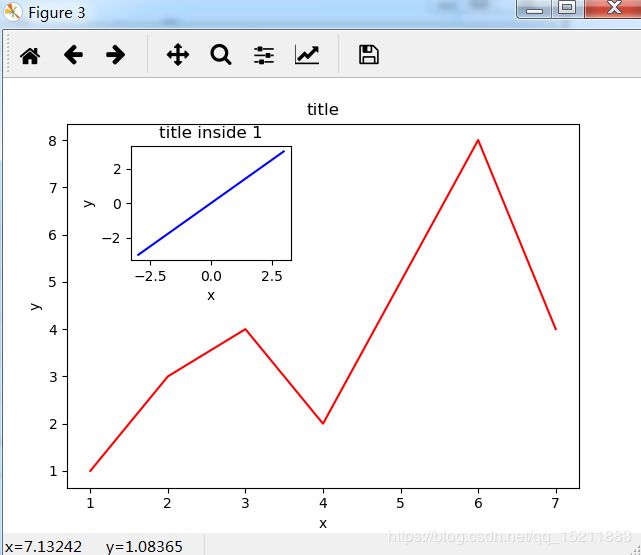
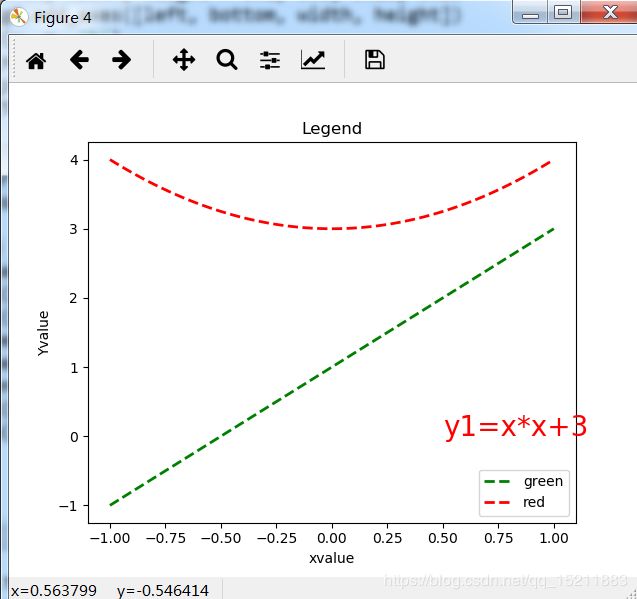
Python画图主要用到matplotlib这个库,具体来说是pylab和pyplot这两个子库。下面主要以pyplot库为基础,介绍柱状图、散点图、等高线图、伪彩图、3D图像、图中图和直线图。
# -*- coding: utf-8 -*-
"""
Created on Mon Jun 17 12:49:47 2019
@author: xiaoxiaoke
"""

import matplotlib.pyplot as plt
import numpy as np
from mpl_toolkits.mplot3d import Axes3D
import cv2

#1、柱状图
n=1024
X=np.random.normal(0,10,n)
Y=np.random.normal(0,10,n)

fig=plt.figure
plt.subplot(221)
plt.title("Bar")
plt.bar(X,Y)
plt.xlim()
plt.ylim(0,30)

#2、散点图
plt.subplot(222)
plt.title("scatter")
colorT=np.arctan2(Y,X)
plt.scatter(X,Y,s=75,c=colorT,alpha=0.5)

plt.xticks(())
plt.yticks(())
plt.show()


#3、等高线图像
def f(x,y):
    # the height function
    return (1 - x / 2 + x**5 + y**3) * np.exp(-x**2 -y**2)

n = 256
x = np.linspace(-3, 3, n)
y = np.linspace(-3, 3, n)
X,Y = np.meshgrid(x, y)

plt.subplot(223)
plt.title("contourf")
C = plt.contour(X, Y, f(X, Y), 8, colors='black', linewidth=.5)
plt.contourf(X, Y, f(X, Y), 8, alpha=.75, cmap=plt.cm.hot)
plt.clabel(C, inline=True, fontsize=10)


#4、显示图像
plt.subplot(224)
plt.title("imshow")
a=np.array([1,2,3,4,5,6,7,8,9]).reshape(3,3)
plt.imshow(a,interpolation='nearest',cmap='bone')
plt.colorbar(shrink=0.9)


#5、3D图像
fig5 = plt.figure()
plt.title("Axes3D")
ax1=Axes3D(fig5)
X=np.arange(-4,4,0.25)
Y=np.arange(-4,4,0.25)
X,Y=np.meshgrid(X,Y)
Z=np.sqrt(X**2+Y**2)
ax1.plot_surface(X, Y, Z, rstride=1, cstride=1, cmap=plt.get_cmap('rainbow'))

#6、图中图
fig6=plt.figure()
x6=[1,2,3,4,5,6,7]
y6=[1,3,4,2,5,8,4]
 #大图
left, bottom, width, height = 0.1, 0.1, 0.8, 0.8
ax1 = fig6.add_axes([left, bottom, width, height])
ax1.plot(x6, y6, 'r')
ax1.set_xlabel('x')
ax1.set_ylabel('y')
ax1.set_title('title')
 #小图
left, bottom, width, height = 0.2, 0.6, 0.25, 0.25
ax2 = fig6.add_axes([left, bottom, width, height])
ax2.plot(y, x, 'b')
ax2.set_xlabel('x')
ax2.set_ylabel('y')
ax2.set_title('title inside 1')

#7、直线图和legend的使用
plt.figure(num=4,figsize=(8,5))
x=np.linspace(-1,1,100)
y=2*x+1
y1=x*x+3
plt.title("Legend")
plt.plot(x,y,color='green',linewidth=2.0,linestyle='--')
plt.plot(x,y1,color='red',linewidth=2.0,linestyle='--')
plt.text(0.5, 0, 'y1=x*x+3', fontdict={'size': 20, 'color':  'red'})
plt.xlabel("xvalue")
plt.ylabel("Yvalue")
plt.legend(["green","red"],loc=4)

plt.show()
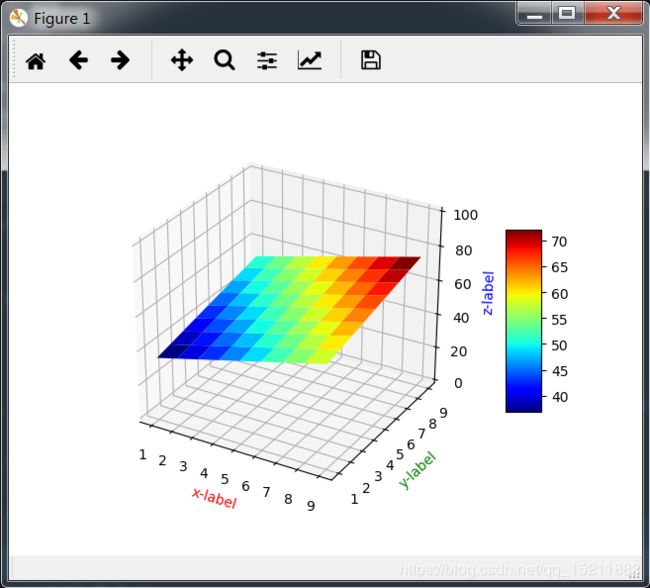
import matplotlib.pyplot as plt
import numpy as np
from matplotlib import cm

fig = plt.figure()
ax = fig.add_subplot(1,1,1,projection='3d')  # 一行一列第一个
X = np.arange(1, 10, 1)
Y = np.arange(1, 10, 1)
X,Y = np.meshgrid(X, Y)  # 将坐标向量变为坐标矩阵,列为x的长度,行为y的长度
Z = 3*X + 2*Y + 30

# 构建平面
surf = ax.plot_surface(X, Y, Z, rstride=1, cstride=1, cmap=cm.jet, linewidth=0, antialiased=True)
# 设置坐标轴
ax.set_xlabel("x-label", color='r')
ax.set_ylabel("y-label", color='g')
ax.set_zlabel("z-label", color='b')
ax.set_zlim3d(0, 100)

# 图例
fig.colorbar(surf, shrink=0.5, aspect=5)
plt.savefig("d3_plane.png")
plt.show()
常用命令:
cla()   # Clear axis即清除当前图形中的当前活动轴。其他轴不受影响。
clf()   # Clear figure清除所有轴,但是窗口打开,这样它可以被重复使用。
close() # Close a figure window
2、opencv库
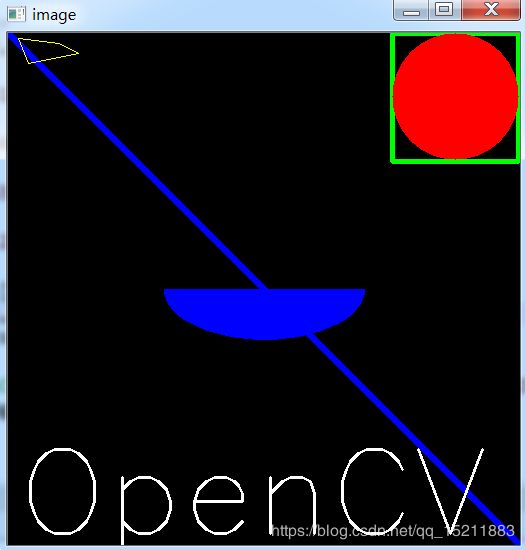
主要介绍直线、矩形框、椭圆和字体注释。
import numpy as np
import cv2

# Create a black image
img=np.zeros((512,512,3), np.uint8)
#直线
cv2.line(img,(0,0),(511,511),(255,0,0),5)
#矩形
cv2.rectangle(img,(384,0),(510,128),(0,255,0),3)
#圆形
cv2.circle(img,(447,63), 63, (0,0,255), -1)
#椭圆
cv2.ellipse(img,(256,256),(100,50),0,0,180,255,-1)
#多边形
pts=np.array([[10,5],[20,30],[70,20],[50,10]], np.int32)
pts=pts.reshape((-1,1,2))
cv2.polylines(img,[pts],True,(0,255,255))
#添加文字
cv2.putText(img,'OpenCV',(10,500), cv2.FONT_HERSHEY_SIMPLEX, 4,(255,255,255),2)
cv2.imshow('image',img)
pyecharts 库
pyecharts是一个用于生成 Echarts 图表的类库, Echarts 是百度开源的一个数据可视化 JS 库,主要用于数据可视化。
3、参考资料
1、https://www.cnblogs.com/ybf-yyj/p/8044136.html
2、https://www.cnblogs.com/xingshansi/p/6777945.html
3、https://www.jb51.net/article/122837.htm
4、莫烦python:https://morvanzhou.github.io/tutorials/data-manipulation/plt/4-3-plot-in-plot/
5、https://blog.csdn.net/owenfy/article/details/79524069
