flink-metric原理与实战
一、背景介绍
flink内部实现了一套metric数据收集库。同时flink自身系统有一些固定的metric数据,包括系统的一些指标,CPU、内存、 IO或者各个task运行的一些指标。具体包含那些指标可以查看官方文档: flink-metric。同时我们也可以利用系统的metric库在自己的代码中进行打点收集metrics数据。此外, flink提供了外部接口reporter,可以用来导出这些metrics数据。
二、Metric类别
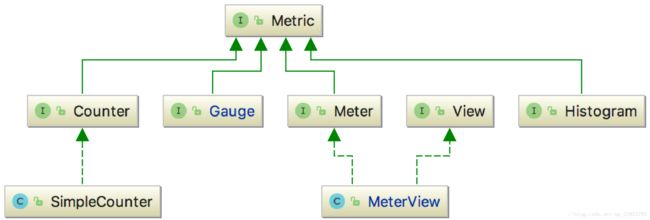
从图中可以看出,Metric这个接口有四个直接子类,分别是:
Gauge —— 最简单的度量指标,只是简单的返回一个值,比如当前实时读取kafka数据的条数
Counter —— 计数器,在一些情况下,会比Gauge高效,比如通过一个AtomicLong变量来统计一个队列的长度;
Meter —— 吞吐量的度量,也就是一系列事件发生的速率,例如TPS;
Histogram —— 度量值的统计结果,如最大值、最小值、平均值,以及分布情况等。
三、Metric使用
在官方的文档中有介绍, 需要继承 Richfunction 才能获得对应的metric对象,用法如下:
public class MyMapper extends RichMapFunction {
  private transient Counter counter;

  @Override
  public void open(Configuration config) {
    this.counter = getRuntimeContext()
      .getMetricGroup()
      .counter("myCounter");
  }

  @Override
  public String map(String value) throws Exception {
    this.counter.inc();
    return value;
  }
}
自定义监控指标会在Flink WebUI显示出来,如需在外部系统显示,需要自定义reporter类。
四、监控指标接入外部系统
Flink 内置了很多 Reporter,对外部系统的技术选型可以参考,比如 JMX 是 java 自带的技术,不严格属于第三方。还有InfluxDB、Prometheus、Slf4j(直接打 log 里)等,调试时候很好用,可以直接看 logger,Flink 本身自带日志系统,会打到 Flink 框架包里面去。
详见官方文档:
https://ci.apache.org/projects/flink/flink-docs-release-1.8/monitoring/metrics.html
1.自定义reporter(参考自带的influxDB)
public class InfluxdbReporter extends AbstractReporter implements Scheduled {

	private String database;
	private String retentionPolicy;
	private InfluxDB influxDB;

	public InfluxdbReporter() {
		super(new MeasurementInfoProvider());
	}

	@Override
	public void open(MetricConfig config) {
		String host = getString(config, HOST);
		int port = getInteger(config, PORT);
		if (!isValidHost(host) || !isValidPort(port)) {
			throw new IllegalArgumentException("Invalid host/port configuration. Host: " + host + " Port: " + port);
		}
		String database = getString(config, DB);
		if (database == null) {
			throw new IllegalArgumentException("'" + DB.key() + "' configuration option is not set");
		}
		String url = String.format("http://%s:%d", host, port);
		String username = getString(config, USERNAME);
		String password = getString(config, PASSWORD);

		this.database = database;
		this.retentionPolicy = getString(config, RETENTION_POLICY);
		if (username != null && password != null) {
			influxDB = InfluxDBFactory.connect(url, username, password);
		} else {
			influxDB = InfluxDBFactory.connect(url);
		}

		log.info("Configured InfluxDBReporter with {host:{}, port:{}, db:{}, and retentionPolicy:{}}", host, port, database, retentionPolicy);
	}

	@Override
	public void close() {
		if (influxDB != null) {
			influxDB.close();
			influxDB = null;
		}
	}

	@Override
	public void report() {
		BatchPoints report = buildReport();
		if (report != null) {
			influxDB.write(report);
		}
	}

	@Nullable
	private BatchPoints buildReport() {
		Instant timestamp = Instant.now();
		BatchPoints.Builder report = BatchPoints.database(database);
		report.retentionPolicy(retentionPolicy);
		try {
			for (Map.Entry, MeasurementInfo> entry : gauges.entrySet()) {
				report.point(MetricMapper.map(entry.getValue(), timestamp, entry.getKey()));
			}

			for (Map.Entry entry : counters.entrySet()) {
				report.point(MetricMapper.map(entry.getValue(), timestamp, entry.getKey()));
			}

			for (Map.Entry entry : histograms.entrySet()) {
				report.point(MetricMapper.map(entry.getValue(), timestamp, entry.getKey()));
			}

			for (Map.Entry entry : meters.entrySet()) {
				report.point(MetricMapper.map(entry.getValue(), timestamp, entry.getKey()));
			}
		}
		catch (ConcurrentModificationException | NoSuchElementException e) {
			// ignore - may happen when metrics are concurrently added or removed
			// report next time
			return null;
		}
		return report.build();
	}

	private static boolean isValidHost(String host) {
		return host != null && !host.isEmpty();
	}

	private static boolean isValidPort(int port) {
		return 0 < port && port <= 65535;
	}
}
2.配置文件
metrics.reporter.influxdb.class: org.apache.flink.metrics.influxdb.InfluxdbReporter
metrics.reporter.influxdb.host: 192.168.2.x
metrics.reporter.influxdb.port: 8086
metrics.reporter.influxdb.db: flink_metrics
metrics.reporter.influxdb.username: gzdata
metrics.reporter.influxdb.password: gzdata
可以自定义配置,在配置文件中配置:
metrics.reporter.your_monitor.config.b: your_b_value然后在open方法中可以直接获取到。
输出到influxDB详见:https://blog.csdn.net/qq_23160237/article/details/98058632