客户流失预警(Predicting customer churn with scikit-learn)
数据集可从这里下载:https://raw.githubusercontent.com/EricChiang/churn/master/data/churn.csv
这里的数据已经结构化了,所以处理起来比较方便。
后序文章会研究非结构化数据处理。
使用pandas方便直接读取.csv里数据
import pandas as pd
import numpy as np

churn_df = pd.read_csv('d:/churn.csv')
col_names = churn_df.columns.tolist()

print "Column names:"
print col_names

to_show = col_names[:6] + col_names[-6:]

print "\nSample data:"
print churn_df[to_show].head(6)
数据集里有的属性是需要分离的,将预测结果分离转化为0,1形式。
churn_result = churn_df['Churn?']
y = np.where(churn_result == 'True.',1,0)
可得到预测结果y[0:30]为:
[0 0 0 0 0 0 0 0 0 0 1 0 0 0 0 1 0 0 0 0 0 1 0 0 0 0 0 0 0 0]
有些属性是不需要的,至于为什么不需要这里直接通过观察得出,没有采用PCA等降为方法。
to_drop = ['State','Area Code','Phone','Churn?']
churn_feat_space = churn_df.drop(to_drop,axis=1)
将属性值yes,no等转化为1,0的值形式。
yes_no_cols = ["Int'l Plan","VMail Plan"]
churn_feat_space[yes_no_cols] = churn_feat_space[yes_no_cols] == 'yes'
获取新的属性和属性值。
features = churn_feat_space.columns
X = churn_feat_space.as_matrix().astype(np.float)
有的数据是规模级别差距较大的,则需要进行处理。
公式为:(X-mean)/std 计算时对每个属性/每列分别进行。
将数据按期属性(按列进行)减去其均值,并处以其方差。得到的结果是,对于每个属性/每列来说所有数据都聚集在-1到1附近,方差为1。
from sklearn.preprocessing import StandardScaler
scaler = StandardScaler()
X = scaler.fit_transform(X)
打印出数据数量和属性个数及分类label
print "Feature space holds %d observations and %d features" % X.shape
print "Unique target labels:", np.unique(y)
Feature space holds 3333 observations and 17 features
Unique target labels: [0 1]
如何验证模型的好坏。
交叉验证方法:
from sklearn.cross_validation import KFold
def run_cv(X,y,clf_class,**kwargs):
    # Construct a kfolds object
    kf = KFold(len(y),n_folds=5,shuffle=True)
    y_pred = y.copy()
    # Iterate through folds
    for train_index, test_index in kf:
        X_train, X_test = X[train_index], X[test_index]
        y_train = y[train_index]
        # Initialize a classifier with key word arguments
        clf = clf_class(**kwargs)
        clf.fit(X_train,y_train)
        y_pred[test_index] = clf.predict(X_test)
    return y_pred*
采用三种方法预测。支持向量机,随机森林,k最近邻算法。然后采用交叉验证的方法来验证。
from sklearn.svm import SVC
from sklearn.ensemble import RandomForestClassifier as RF
from sklearn.neighbors import KNeighborsClassifier as KNN

def accuracy(y_true,y_pred):
    # NumPy interprets True and False as 1. and 0.
    return np.mean(y_true == y_pred)

print "Support vector machines:"
print "%.3f" % accuracy(y, run_cv(X,y,SVC))
print "Random forest:"
print "%.3f" % accuracy(y, run_cv(X,y,RF))
print "K-nearest-neighbors:"
print "%.3f" % accuracy(y, run_cv(X,y,KNN))
Support vector machines:
0.918
Random forest:
0.944
K-nearest-neighbors:
0.896
可以看出随机森林胜出。
准确率和召回率
采用混淆矩阵的方法
 from sklearn.metrics import confusion_matrix

y = np.array(y)
class_names = np.unique(y)

confusion_matrices = [
    ( "Support Vector Machines", confusion_matrix(y,run_cv(X,y,SVC)) ),
    ( "Random Forest", confusion_matrix(y,run_cv(X,y,RF)) ),
    ( "K-Nearest-Neighbors", confusion_matrix(y,run_cv(X,y,KNN)) ),
]

# Pyplot code not included to reduce clutter
from churn_display import draw_confusion_matrices
%matplotlib inline

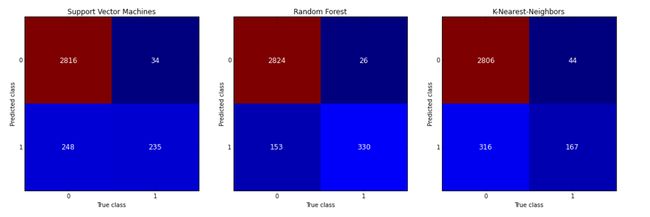
draw_confusion_matrices(confusion_matrices,class_names)
An important question to ask might be, When an individual churns, how often does my classifier predict that correctly? This measurement is called “recall” and a quick look at these diagrams can demonstrate that random forest is clearly best for this criteria. Out of all the churn cases (outcome “1”) random forest correctly retrieved 330 out of 482. This translates to a churn “recall” of about 68% (330/482≈2/3), far better than support vector machines (≈50%) or k-nearest-neighbors (≈35%).
Another question of importance is “precision” or, When a classifier predicts an individual will churn, how often does that individual actually churn? The differences in semantic are small from the previous question, but it makes quite a different. Random forest again out preforms the other two at about 93%
precision (330 out of 356) with support vector machines a little behind at about 87% (235 out of 269). K-nearest-neighbors lags at about 80%.
待续。。。。。

