数据分析 NO.14 科赛网Pandas练习题
Pandas练习题
知识点:
练习一:
df=pd.read_csv( )
df[“item_name”].value_counts() 对item_name计数
df[“item_name”].unique() 列出item_name不重复的数据
df[“item_name”].nunique() 列出item_name不重复的数据的个数!!
1.将item_price转换为浮点数:
dollarizer = lambda x: float(x[1:-1])
df.item_price = df["item_price"].apply(dollarizer)
2.在该数据集对应的时期内,一共有多少订单
chipo.order_id.value_counts().count()   = chipo["order_id"].value_counts().count   总体计数
np.max(chipo["order_id"])
3.每一单(order)对应的平均总价是多少?
 order_grouped = chipo.groupby(by=['order_id']).sum()
 order_grouped.mean()['item_price']

 或

chipo.groupby(by=['order_id']).sum().mean()['item_price']

或
grouped=chipo.groupby("order_id").sum()
groupedvalue=grouped.mean()
groupedvalue
4.一共有多少种不同的商品被售出
chipo.item_name.value_counts().count()
chipo["item_name"].nunique()
练习二:
1.将数据集中的列Team, Yellow Cards和Red Cards单独存为一个名叫discipline的数据框
discipline = euro12[['Team', 'Yellow Cards', 'Red Cards']]
discipline
或
discipline=pd.DataFrame({"Team":euro12["Team"],"Yellow Cards":euro12["Yellow Cards"],"Red Cards":euro12["Red Cards"]})
discipline
2.对数据框discipline按照先Red Cards再Yellow Cards进行排序.其中Red 和Yellow 是列
discipline.sort_values(['Red Cards', 'Yellow Cards'], ascending = False)
round() :round() 方法返回浮点数x的四舍五入值。
round(80.23456, 2) :  80.23
round(100.000056, 3) :  100.0
round(-100.000056, 3) :  -100.0
3.选取以字母G开头的球队数据
euro12[euro12.Team.str.startswith('G')]
或
euro12[euro12["Team"].str.startswith("G")]
4.找到英格兰(England)、意大利(Italy)和俄罗斯(Russia)的射正率(Shooting Accuracy)
euro12.loc[euro12.Team.isin(['England', 'Italy', 'Russia']), ['Team','Shooting Accuracy']]

或
不建议用下面这种!!
euro=euro12.set_index("Team")
euro.loc[['England', 'Italy', 'Russia'],"Shooting Accuracy"]
练习三:
1.打印出每个大陆每种酒类别的消耗中位数 median() 中位数
drinks.groupby('continent').median()
2.打印出每个大陆对spirit饮品消耗的平均值,最大值和最小值
grouped=drinks.groupby("continent")
grouped["spirit"].mean()
grouped["spirit"].max()
grouped["spirit"].min()

grouped["spirit"].agg([np.mean,np.max,np.min])
练习4:
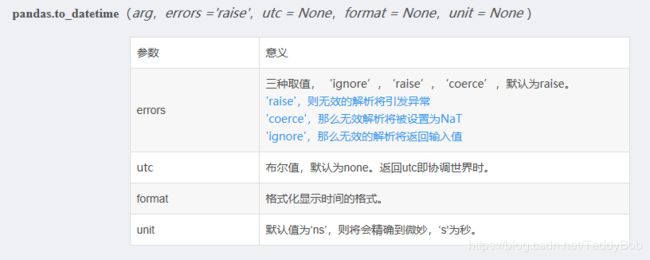
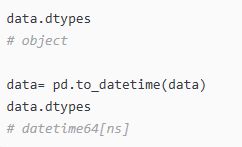
1.将Year的数据类型转换为 datetime64
crime.Year = pd.to_datetime(crime.Year, format='%Y')
crime.info()
通过pandas.read_csv()或者pandas.read_excel()读取文件过后,得到的数据列对应的类型是“object”,这样没法对时间数据处理,可以用过pd.to_datetime将该列数据转换为时间类型,即datetime。
自己写:
a=[lambda s:pd.to_datetime(s[“Year”],format="%Y") ]
b=crime[“Year”].apply(a)
直接报错Year
3.按照Year对数据框进行分组并求和
注意Population这一列,若直接对其求和,是不正确的*
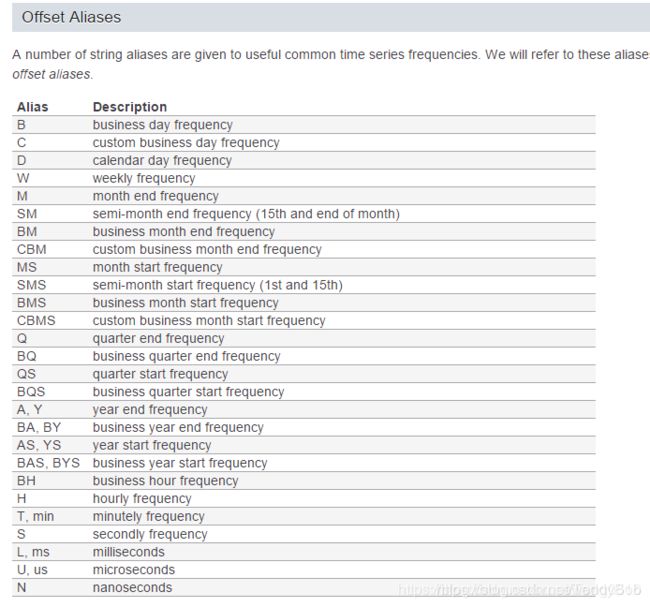
crimes = crime.resample('10AS').sum()

# 用resample去得到“Population”列的最大值
population = crime['Population'].resample('10AS').max()

# 更新 "Population"
crimes['Population'] = population

crimes
4.何时是美国历史上生存最危险的年代
crime.idxmax(0)
.idxmax() 获取最大值的索引
练习5:
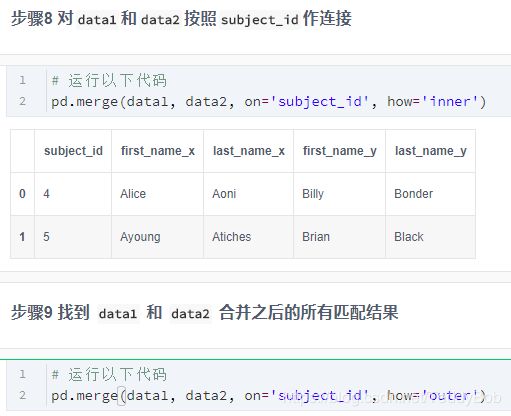
1.将data1和data2两个数据框按照行的维度进行合并,命名为all_data
all_data = pd.concat([data1, data2])
all_data
步骤5 有问题
2.按照subject_id的值对all_data和data3作合并
merge(all_data,data,on="subject_id")
data = pd.read_table(path6, sep = "\s+", parse_dates = [[0,1,2]])
data.head()
或
data.set_index(list(data.conlumns[0:3]))
read_table默认是’\t’(也就是tab)切割数据集的;
read_csv默认是’,’(也就是逗号)切割数据集的;
其他,除了方法名不一样,都一样
parse_dates = [‘col_name’] # 指定某行读取为日期格式
data1 = pd.read_csv(path6, sep = "\s+", parse_dates = [[0,1,2]])
data2=data1.set_index(key=data1.columns[0:3])
- 2061年?我们真的有这一年的数据?创建一个函数并用它去修复这个bug
def fix_century(x):
  year = x.year - 100 if x.year > 1989 else x.year
  return datetime.date(year, x.month, x.day)

# apply the function fix_century on the column and replace the values to the right ones
data['Yr_Mo_Dy'] = data['Yr_Mo_Dy'].apply(fix_century)

# data.info()
data.head()
3.将日期设为索引,注意数据类型,应该是datetime64[ns]
# transform Yr_Mo_Dy it to date type datetime64
data["Yr_Mo_Dy"] = pd.to_datetime(data["Yr_Mo_Dy"])

# set 'Yr_Mo_Dy' as the index
data = data.set_index('Yr_Mo_Dy')

data.head()
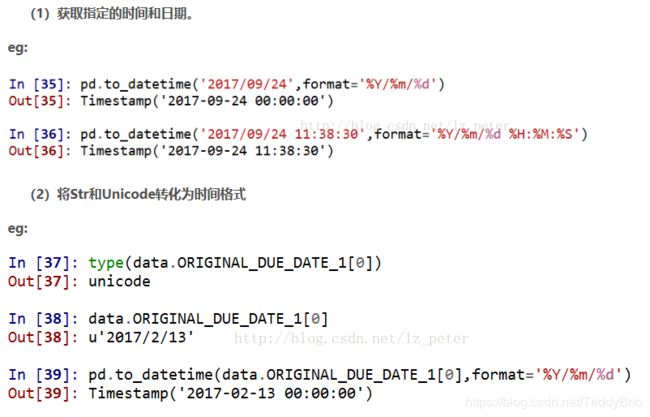
pd.to_datetime( ) (1)获取指定的时间和日期。 (2)将Str和Unicode转化为时间格式
4.数据缺失值
.isnull()
5.创建一个名为loc_stats的数据框去计算并存储每个location的风速最小值,最大值,平均值和标准差
loc_stats = pd.DataFrame()

loc_stats['min'] = data.min() # min
loc_stats['max'] = data.max() # max
loc_stats['mean'] = data.mean() # mean
loc_stats['std'] = data.std() # standard deviations

loc_stats
6.创建一个名为day_stats的数据框去计算并存储所有location的风速最小值,最大值,平均值和标准差
day_stats = pd.DataFrame()

# this time we determine axis equals to one so it gets each row.
day_stats['min'] = data.min(axis = 1) # min
day_stats['max'] = data.max(axis = 1) # max
day_stats['mean'] = data.mean(axis = 1) # mean
day_stats['std'] = data.std(axis = 1) # standard deviations

day_stats.head()
7.对于每一个location,计算一月份的平均风速
data['date'] = data.index

# creates a column for each value from date
data['month'] = data['date'].apply(lambda date: date.month)
data['year'] = data['date'].apply(lambda date: date.year)
data['day'] = data['date'].apply(lambda date: date.day)

# gets all value from the month 1 and assign to janyary_winds
january_winds = data.query('month == 1')

# gets the mean from january_winds, using .loc to not print the mean of month, year and day
january_winds.loc[:,'RPT':"MAL"].mean()
8.对于数据记录按照年为频率取样,对于数据记录按照月为频率取样
data.query('month == 1 and day == 1')

data.query("day==1")
练习7:可视化
练习9:
1.将Date这个列转换为datetime类型
apple.Date = pd.to_datetime(apple.Date)
apple['Date'].head()
2.有重复的日期吗?
apple.index.is_unique
3.将index设置为升序
apple.sort_index(ascending = True).head()
4.找到每个月的最后一个交易日(business day)
apple_month = apple.resample('BM').mean()
apple_month.head()
5.数据集中最早的日期和最晚的日期相差多少天?
(apple.index.max()-apple.index,min()).days
6.在数据中一共有多少个月
apple_months = apple.resample('BM').mean()
len(apple_months.index)
7.步骤12可视化
练习10:
1.数据框中有缺失值吗?
iris.isnull().sum()
2.将列petal_length的第10到19行设置为缺失值
iris.iloc[10:20,2:3] = np.nan
iris.head(20)
3.将缺失值全部替换为1.0
iris.petal_length.fillna(1, inplace = True)
缺失值: np.nan
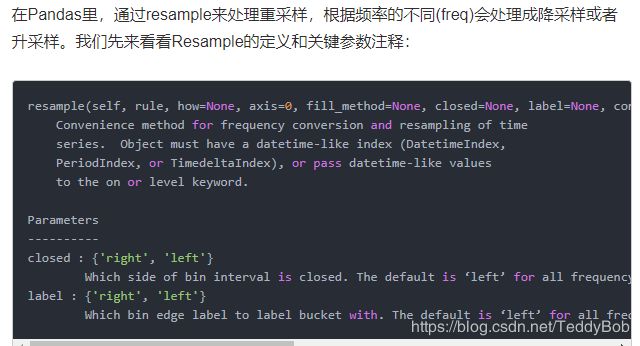
关于 resample函数 参考[Pandas时间序列重采样(resample)方法中closed、label的作用],(https://www.jianshu.com/p/061771f0afa9)
Resample函数使用
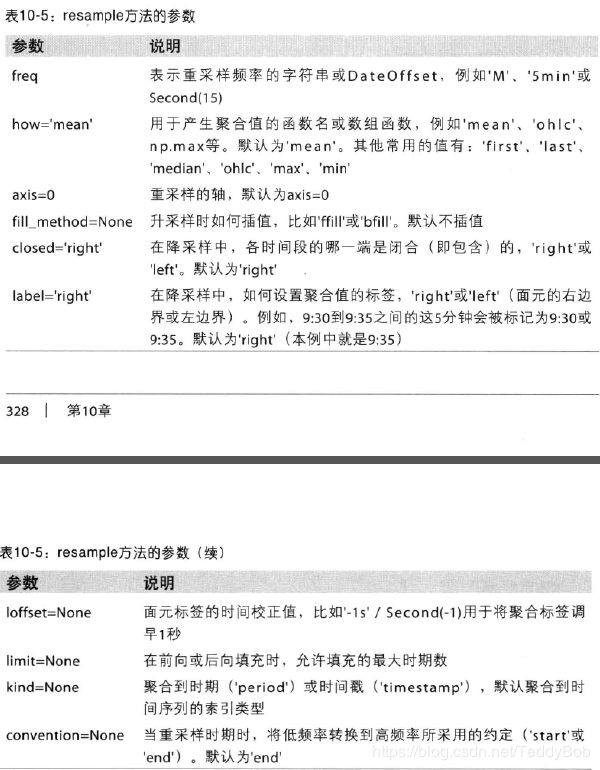
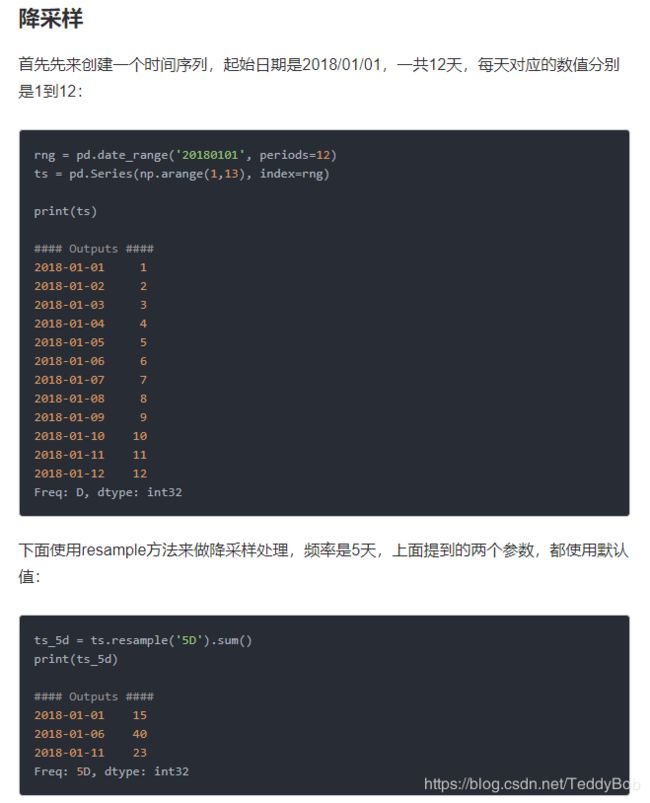
降采样:时间粒度变大。例如,原来是按天统计的数据,现在变成按周统计。降采样会涉及到数据的聚合,比如天数据变成周数据,那么就得对一周的7天数据聚合,聚合的方式可以是求和,求均值等等。
升采样:时间粒度变小。例如,原来是按周统计的数据,现在变成按天统计。升采样会涉及到数据的填充,根据填充的方法不同填充的数据也就不同。
关于其余参数含义:
也可以通过groupby的方式进行降采样
df = pd.read_csv()
grouped_mean = df.groupyby(df["time"].apply(lambda a:a.month))
grouped_mean = df.groupby(df["datatime"].apply(lambda d:d.min)).mean()

