关于 使用pyecharts进行数据可视化分析 的学习报告II
目录
- 学习重点
- 学习过程
- 练习题
- 树图、矩形树图
- 相关性矩阵图
- 地图
- 热点图
- 词云图
- 主题河流图
学习重点
- pyecharts绘制树图
- 散点图矩阵绘制
- 词云图、主题河流图、文本关系图的绘制
- 地理热力图、地图上标注点的绘制
学习过程
- 在开始绘制前,先来复习一下 如何使用python读取json文件
	import json
	jsonPath = 'json文件路径'
	#使用load方法读取json文件
	with open(jsonPath, 'r') as f:
	    data=json.load(f)
	print(data)
- 关于基础图例的绘制方法可以参考pyecharts官方文档
- 关于绘制多个图例(以树图为例)
	from pyecharts import options as opts
	from pyecharts.charts import Tree,Page,TreeMap
#绘制图例函数,返回图例
	def tree_data() -> Tree:
		 tree = (Tree(),...)
    	 return tree
    def treeMap_data() -> Tree:
		 treeMap = (TreeMap(),...)
    	 return treeMap
#在 page 中定义这两个图例
    def page_draggable_layout():
    page = Page(layout=Page.DraggablePageLayout)
    page.add(
        tree_data(),
        treeMap_data(),
    )
    page.render("html/①树图.html")

 #调用这个函数
	if __name__ == "__main__":
   		 page_draggable_layout()
- 下面通过练习题,复习和巩固所学的知识
练习题
树图、矩形树图
- 使用以下JSON数据绘制树图、矩形树图。
data = [{…}]
"""
@desc:
@author: Chale
@software: PyCharm on 2020/6/11 14:13
"""
from pyecharts import options as opts
from pyecharts.charts import Tree,Page,TreeMap

data = [{
    "name": "flare",
    "children": [
        {
            "name": "flex",
            "children": [
                {"name": "FlareVis", "value": 4116}
            ]
        },
        {
            "name": "scale",
            "children": [
                {"name": "IScaleMap", "value": 2105},
                {"name": "LinearScale", "value": 1316},
                {"name": "LogScale", "value": 3151},
                {"name": "OrdinalScale", "value": 3770},
                {"name": "QuantileScale", "value": 2435},
                {"name": "QuantitativeScale", "value": 4839},
                {"name": "RootScale", "value": 1756},
                {"name": "Scale", "value": 4268},
                {"name": "ScaleType", "value": 1821},
                {"name": "TimeScale", "value": 5833}
           ]
        },
        {
            "name": "display",
            "children": [
                {"name": "DirtySprite", "value": 8833}
           ]
        }
    ]
}]

def tree_data() -> Tree:
    tree = (
        Tree()
        .add("", data)
        .set_global_opts(title_opts=opts.TitleOpts(title="Tree-树图"))
    )
    return tree

def treeMap_data() -> TreeMap:
    treeMap = (
        TreeMap()
        .add("演示数据", data)
        .set_global_opts(title_opts=opts.TitleOpts(title="TreeMap-矩形树图"))
    )
    return treeMap

def page_draggable_layout():
    page = Page(layout=Page.DraggablePageLayout)
    page.add(
        tree_data(),
        treeMap_data(),
    )
    page.render("html/①树图.html")

if __name__ == "__main__":
    page_draggable_layout()
相关性矩阵图
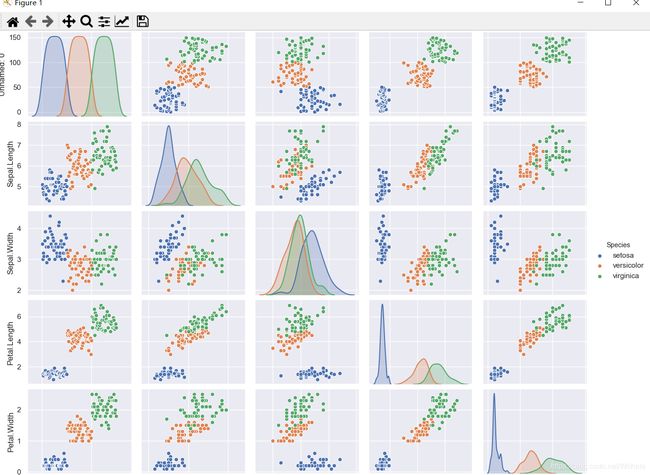
- 绘制鸢尾花数据的相关性矩阵(数据:iris.csv)
"""
@desc:
@author: Chale
@software: PyCharm on 2020/6/11 12:45
"""

import pandas as pd
import matplotlib.pyplot as plt
import seaborn as sns
data = pd.read_csv("../file/iris.csv")
sns.set()
sns.pairplot(data,hue="Species")
plt.show()
地图
- 在地图上用圆点标出各省的销售额数据,数据如下:
province = [‘广东’, ‘湖北’, ‘湖南’, ‘四川’, ‘重庆’, ‘黑龙江’, ‘浙江’, ‘山西’, ‘河北’, ‘安徽’, ‘河南’, ‘山东’, ‘西藏’]
data = [(i, random.randint(50, 150)) for i in province]
"""
@desc:
@author: Chale
@software: PyCharm on 2020/6/11 21:21
"""
import random
from pyecharts import options as opts
from pyecharts.charts import Map

province = ['广东', '湖北', '湖南', '四川', '重庆', '黑龙江', '浙江', '山西', '河北', '安徽', '河南', '山东', '西藏']
data = [(i, random.randint(50, 150)) for i in province]

c = (
    Map()
    .add("各省销售额", data, "china")
    .set_global_opts(title_opts=opts.TitleOpts(title="Map-地图"))
    .render("html/③ 地图.html")
)
热点图
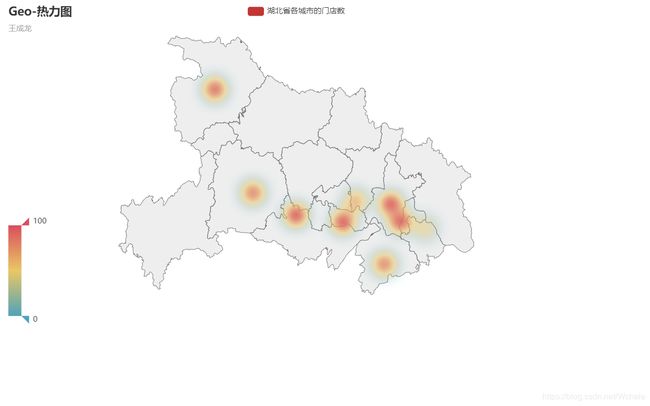
- 绘制地理热点图展示某连锁企业在湖北省各城市的门店数。
数据如下:
province = [‘武汉’, ‘十堰’, ‘鄂州’, ‘宜昌’, ‘荆州’, ‘孝感’, ‘黄石’, ‘咸宁’, ‘仙桃’]
data = [(i, random.randint(50, 150)) for i in province]
"""
@desc:
@author: Chale
@software: PyCharm on 2020/6/11 22:10
"""
import random
from pyecharts import options as opts
from pyecharts.charts import Geo
from pyecharts.globals import ChartType

province = ['武汉', '十堰', '鄂州', '宜昌', '荆州', '孝感', '黄石', '咸宁', '仙桃']
data = [(i, random.randint(50, 150)) for i in province]

c = (
    Geo()

    .add_schema(maptype="湖北")
    .add(
        "湖北省各城市的门店数",
        data,
        type_=ChartType.HEATMAP,

    )
    .set_series_opts(label_opts=opts.LabelOpts(is_show=False))
    .set_global_opts(
        visualmap_opts=opts.VisualMapOpts(),
        title_opts=opts.TitleOpts(title="Geo-热力图", subtitle="Chale"),

    )

    .render("html/④ 热力图.html")

)
词云图
- 绘制词云图(数据:word_data.csv)
@desc:
@author: Chale
@software: PyCharm on 2020/6/11 22:06
"""

from pyecharts import options as opts
from pyecharts.charts import WordCloud
import pandas as pd

word_data = pd.read_csv("../file/word_data.csv")

name = word_data['category'].tolist()
value = word_data['views'].tolist()
words = []

for i in range(len(name)):
    word=(name[i],value[i])
    words.append(word)

c = (
    WordCloud()
    .add("词云图", words, word_size_range=[40, 200])
    .set_global_opts(title_opts=opts.TitleOpts(title="词云图",subtitle="Chale"))
    .render("html/⑤ 词云图.html")
)
在这里插入代码片
主题河流图
- 绘制主题河流图
datax = [‘分支1’, ‘分支2’, ‘分支3’, ‘分支4’, ‘分支5’, ‘分支6’]
datay = [[‘2015/11/08’, 10, ‘分支1’], [‘2015/11/09’, 15, ‘分支1’], ,…]
"""
@desc:
@author: Chale
@software: PyCharm on 2020/6/11 22:15
"""
import pyecharts.options as opts
from pyecharts.charts import ThemeRiver


datax = ['分支1', '分支2', '分支3', '分支4', '分支5', '分支6']
datay = [
    ['2015/11/08', 10, '分支1'], ['2015/11/09', 15, '分支1'], ['2015/11/10', 35, '分支1'],
    ['2015/11/14', 7, '分支1'], ['2015/11/15', 2, '分支1'], ['2015/11/16', 17, '分支1'],
    ['2015/11/17', 33, '分支1'], ['2015/11/18', 40, '分支1'], ['2015/11/19', 32, '分支1'],
    ['2015/11/20', 26, '分支1'], ['2015/11/21', 35, '分支1'], ['2015/11/22', 40, '分支1'],
    ['2015/11/23', 32, '分支1'], ['2015/11/24', 26, '分支1'], ['2015/11/25', 22, '分支1'],
    ['2015/11/08', 35, '分支2'], ['2015/11/09', 36, '分支2'], ['2015/11/10', 37, '分支2'],
    ['2015/11/11', 22, '分支2'], ['2015/11/12', 24, '分支2'], ['2015/11/13', 26, '分支2'],
    ['2015/11/14', 34, '分支2'], ['2015/11/15', 21, '分支2'], ['2015/11/16', 18, '分支2'],
    ['2015/11/17', 45, '分支2'], ['2015/11/18', 32, '分支2'], ['2015/11/19', 35, '分支2'],
    ['2015/11/20', 30, '分支2'], ['2015/11/21', 28, '分支2'], ['2015/11/22', 27, '分支2'],
    ['2015/11/23', 26, '分支2'], ['2015/11/24', 15, '分支2'], ['2015/11/25', 30, '分支2'],
    ['2015/11/26', 35, '分支2'], ['2015/11/27', 42, '分支2'], ['2015/11/28', 42, '分支2'],
    ['2015/11/08', 21, '分支3'], ['2015/11/09', 25, '分支3'], ['2015/11/10', 27, '分支3'],
    ['2015/11/11', 23, '分支3'], ['2015/11/12', 24, '分支3'], ['2015/11/13', 21, '分支3'],
    ['2015/11/14', 35, '分支3'], ['2015/11/15', 39, '分支3'], ['2015/11/16', 40, '分支3'],
    ['2015/11/17', 36, '分支3'], ['2015/11/18', 33, '分支3'], ['2015/11/19', 43, '分支3'],
    ['2015/11/20', 40, '分支3'], ['2015/11/21', 34, '分支3'], ['2015/11/22', 28, '分支3'],
    ['2015/11/14', 7, '分支4'], ['2015/11/15', 2, '分支4'], ['2015/11/16', 17, '分支4'],
    ['2015/11/17', 33, '分支4'], ['2015/11/18', 40, '分支4'], ['2015/11/19', 32, '分支4'],
    ['2015/11/20', 26, '分支4'], ['2015/11/21', 35, '分支4'], ['2015/11/22', 40, '分支4'],
    ['2015/11/23', 32, '分支4'], ['2015/11/24', 26, '分支4'], ['2015/11/25', 22, '分支4'],
    ['2015/11/26', 16, '分支4'], ['2015/11/27', 22, '分支4'], ['2015/11/28', 10, '分支4'],
    ['2015/11/08', 10, '分支5'], ['2015/11/09', 15, '分支5'], ['2015/11/10', 35, '分支5'],
    ['2015/11/11', 38, '分支5'], ['2015/11/12', 22, '分支5'], ['2015/11/13', 16, '分支5'],
    ['2015/11/14', 7, '分支5'], ['2015/11/15', 2, '分支5'], ['2015/11/16', 17, '分支5'],
    ['2015/11/17', 33, '分支5'], ['2015/11/18', 40, '分支5'], ['2015/11/19', 32, '分支5'],
    ['2015/11/20', 26, '分支5'], ['2015/11/21', 35, '分支5'], ['2015/11/22', 4, '分支5'],
    ['2015/11/23', 32, '分支5'], ['2015/11/24', 26, '分支5'], ['2015/11/25', 22, '分支5'],
    ['2015/11/26', 16, '分支5'], ['2015/11/27', 22, '分支5'], ['2015/11/28', 10, '分支5'],
    ['2015/11/08', 10, '分支6'], ['2015/11/09', 15, '分支6'], ['2015/11/10', 35, '分支6'],
    ['2015/11/11', 38, '分支6'], ['2015/11/12', 22, '分支6'], ['2015/11/13', 16, '分支6'],
    ['2015/11/14', 7, '分支6'], ['2015/11/15', 2, '分支6'], ['2015/11/16', 17, '分支6'],
    ['2015/11/17', 33, '分支6'], ['2015/11/18', 4, '分支6'], ['2015/11/19', 32, '分支6'],
    ['2015/11/20', 26, '分支6'], ['2015/11/21', 35, '分支6'], ['2015/11/22', 40, '分支6'],
    ['2015/11/23', 32, '分支6'], ['2015/11/24', 26, '分支6'], ['2015/11/25', 22, '分支6']
]

(
    ThemeRiver(init_opts=opts.InitOpts(width="1600px", height="800px"))
    .add(
        series_name=datax,
        data=datay,
        singleaxis_opts=opts.SingleAxisOpts(
            pos_top="50", pos_bottom="50", type_="time"
        ),
    )
    .set_global_opts(
        tooltip_opts=opts.TooltipOpts(trigger="axis", axis_pointer_type="line"),
        title_opts=opts.TitleOpts(title="主题河流图", subtitle="Chale")
    )
    .render("html/⑥河流图.html")
)


