MATLAB学习笔记——影像处理入门
前言
本次主要是为了记录下学习和复习MATLAB中的知识点,以此来巩固一下自己薄弱的知识体系,MATLAB前面基础零散的小知识点就暂时先不管,这次直接奔向画图模块,事先声明,本人是跟着的B站上的教程视频 MATLAB教程_台大郭彦甫(14课)原视频补档,所以博客中的大部分案例也都来自郭老师得教案。
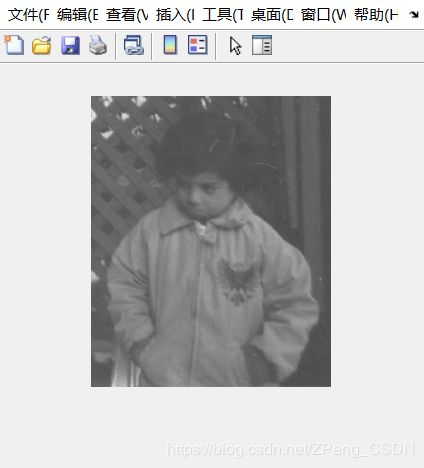
读取与展示图片
I = imread('pout.tif'); %read
imshow(I); %show
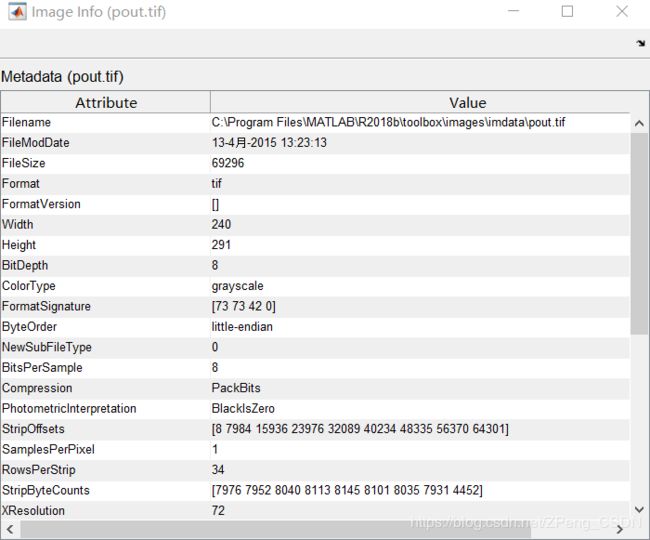
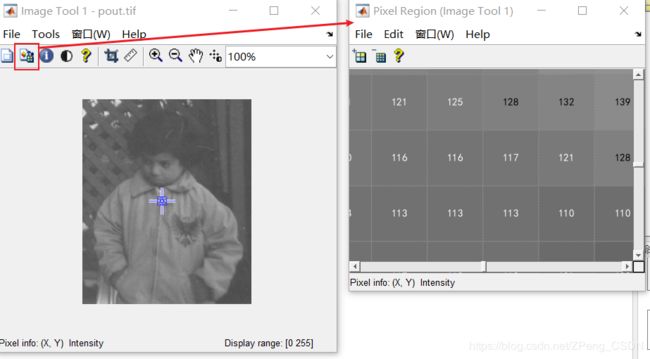
读取图片详细详细
imageinfo('pout.tif')
imtool('pout.tif')
MATLAB处理图像
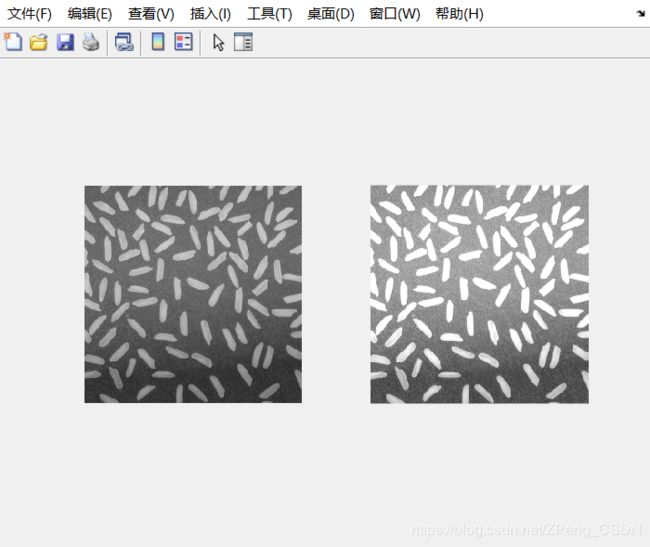
图像乘法
I=imread('rice.png');
subplot(1,2,1); imshow(I);
J=immultiply(I, 1.5);
subplot(1,2,2); imshow(J);
immultiply - Multiply two images or multiply image by constant
This MATLAB function multiplies each element in array X by the corresponding element in array Y and returns the product in the corresponding element of the output array Z.(图像内每个数值都乘以传进去的参数,像上面例子就乘以1.5——放亮1.5倍)
图像加法
I=imread('rice.png');
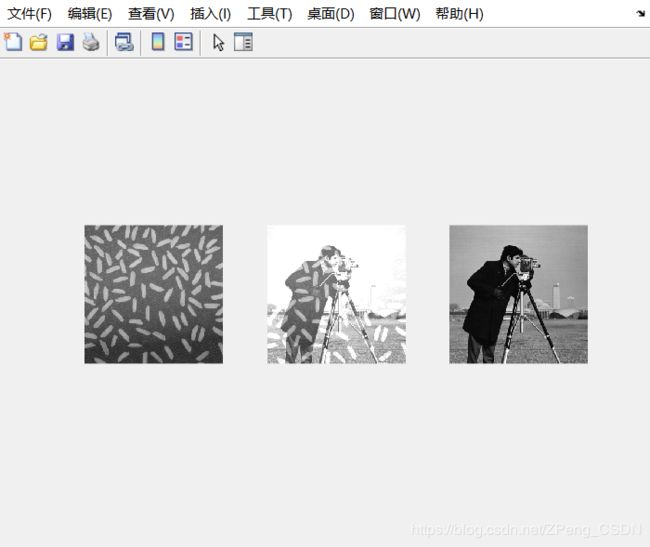
J=imread('cameraman.tif'); K=imadd(I,J);
subplot(1,3,1); imshow(I);
subplot(1,3,2); imshow(K);
subplot(1,3,3); imshow(J);
imadd - Add two images or add constant to image
This MATLAB function adds each element in array X with the corresponding element in array Y and returns the sum in the corresponding element of the output array Z
注意:两张图片必须一样,即矩阵一样,不然无法相加。相加的原理即刚刚矩阵内的值相加,所以无论两张原图有多暗,相加后都会变亮,因为相加后值变大了。
展示灰度值
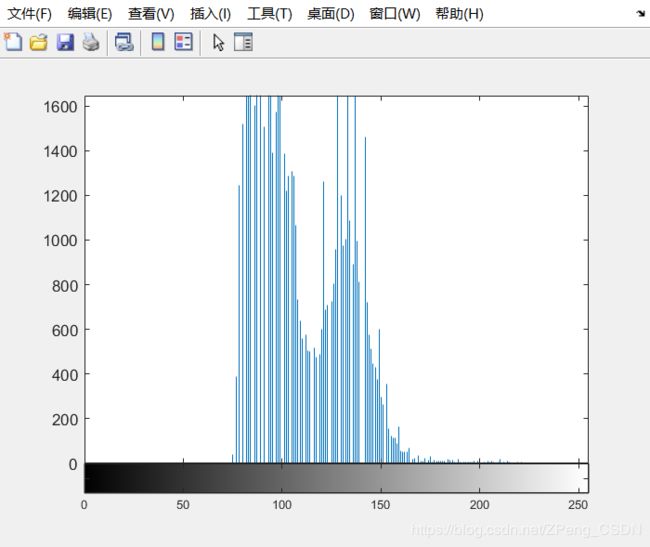
I = imread('pout.tif');
imhist(I);
imhist - Histogram of image data
This MATLAB function calculates the histogram(柱状图) for the grayscale(灰度值) image I.
提高对比度
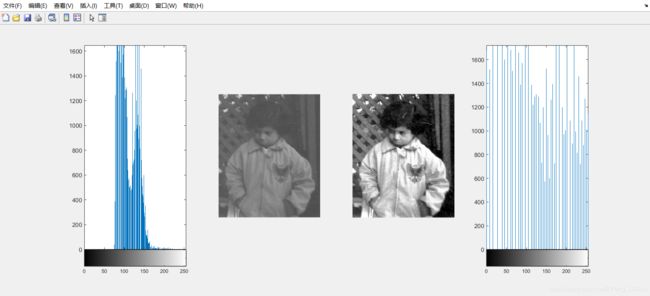
I = imread('pout.tif'); I2 = histeq(I);
subplot(1,4,1); imhist(I);
subplot(1,4,2); imshow(I);
subplot(1,4,3); imshow(I2);
subplot(1,4,4); imhist(I2);
histeq - Enhance contrast(对比度) using histogram equalization(均衡)
This MATLAB function transforms the grayscale image I so that the histogram of the output grayscale image J with length(hgram) bins approximately(大约) matches(匹配) the target histogram hgram.
旋转图片
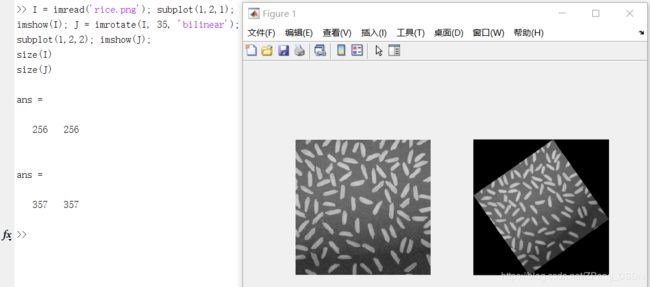
I = imread('rice.png'); subplot(1,2,1);
imshow(I); J = imrotate(I, 35, 'bilinear');
subplot(1,2,2); imshow(J);
size(I)
size(J)
imrotate - Rotate(旋转) image
This MATLAB function rotates image I by angle degrees in a counterclockwise direction(逆时针方向) around its center point.
保存图片
imwrite(I, 'pout2.png');
imwrite - 将图像写入图形文件
此 MATLAB 函数 将图像数据 A 写入 filename 指定的文件,并从扩展名推断出文件格式。imwrite 在当前文件夹中创建新文件。输出图像的位深度取决于 A 的数据类型和文件格式。
