使用决策树和随机森林分析预测糖尿病
使用决策树与随机森林预测糖尿病
数据源: https://www.kaggle.com/uciml/pima-indians-diabetes-database#diabetes.csv
目的:生成决策树可视化;输出决策树和随机森林的性能报告;画出ROC图;分析不同特征的重要性
(作笔记使用,如有错误,欢迎指正!)
导入数据:
import pandas as pd
data = pd.read_csv('./datasets.csv')
data.head()
标题解释:
·Pregnancies:怀孕(次数)
·Glucose:葡萄糖
·BloodPressure:血压
·SkinThickness:皮肤厚度
·Insulin:胰岛素
·BMI:体重指数
·DiabetesPedigreeFunction:糖尿病谱系功能
·Age:年龄
·Outcome:结果
代码:
输出决策树和随机森林的性能报告
import pandas as pd
import numpy as np
from pandas import DataFrame
from sklearn.metrics import roc_auc_score
from sklearn.metrics import classification_report
from sklearn.ensemble import RandomForestClassifier
from sklearn import tree
from sklearn.tree import DecisionTreeClassifier
from sklearn.model_selection import train_test_split
# 读取数据
data = pd.read_csv('./datasets.csv')
# 将预测标签Outcome数据放到第一列
front = data['Outcome']
data.drop(labels='Outcome',axis = 1, inplace = True)
data.insert(0,'Outcome',front)
y = data.iloc[:,0]
x = data.iloc[:,1:]
x_train, x_test, y_train, y_test = train_test_split(x,y,test_size=30/768)
# 决策树
# max_depth=3定义树的深度, 可以用来防止过拟合
# min_weight_fraction_leaf 定义叶子节点最少要包含多少个样本(百分比表达), 防止过拟合
dtree = tree.DecisionTreeClassifier(criterion='entropy',max_depth=3,min_weight_fraction_leaf=0.01)
dtree = dtree.fit(x_train,y_train)
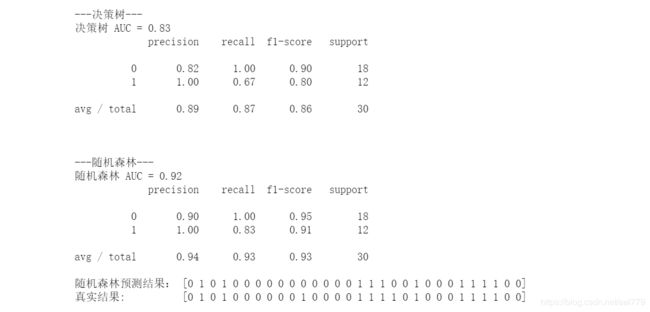
print('\n\n---决策树---')
dt_roc_auc = roc_auc_score(y_test,dtree.predict(x_test))
print('决策树 AUC = %2.2f'%dt_roc_auc)
print(classification_report(y_test,dtree.predict(x_test)))
# 随机森林
# max_depth=None 定义树的深度,可以用来防止过拟合
# min_samples_split=10 定义至少多少个样本的情况下才继续分叉,可以用来防止过拟合
rf = RandomForestClassifier(criterion='entropy',n_estimators=1000,max_depth=None,min_samples_split=10,min_weight_fraction_leaf=0.02)
rf.fit(x_train,y_train)
print('\n\n---随机森林---')
rf_roc_auc = roc_auc_score(y_test,rf.predict(x_test))
print('随机森林 AUC = %2.2f'%rf_roc_auc)
print(classification_report(y_test,rf.predict(x_test)))
y_ = np.array(y_test)
print('随机森林预测结果:',rf.predict(x_test))
print('真实结果: ',y_)
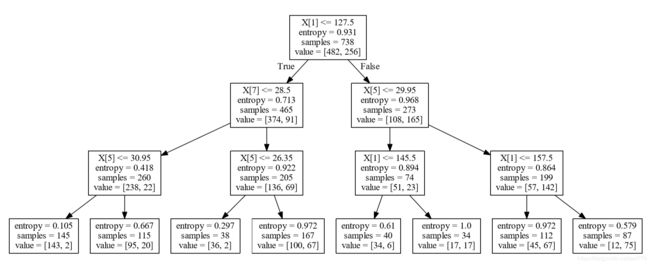
# 决策树可视化
# 生成.dot文件
with open('treeone.dot', 'w') as f:
dot_data = tree.export_graphviz(dtree, out_file=None)
f.write(dot_data)决策树和随机森林的性能报告:
生成决策树可视化:
# 决策树可视化
# 生成.dot文件
with open('treeone.dot', 'w') as f:

    dot_data = tree.export_graphviz(dtree, out_file=None)

    f.write(dot_data)
会在当前目录上生成一个.dot文件,然后打开cmd,定位到.dot文件所在的路径,运行命令:dot -Tpdf treeone.dot -o treeone.pdf
则会在当前目录上生成pdf文件
(注:这里要安装Graphviz,并配置好环境变量,安装教程可参考这里;可视化决策树可参考这里)
生成后的pdf大概是这样:
ROC图
from sklearn.metrics import roc_curve
import matplotlib.pyplot as plt
%matplotlib inline

rf_fpr, rf_tpr, rf_thresholds = roc_curve(y_test,rf.predict_proba(x_test)[:,1])
dt_fpr, dt_tpr, dt_thresholds = roc_curve(y_test,dtree.predict_proba(x_test)[:,1])
plt.figure()

# 随机森林 ROC
plt.plot(rf_fpr,rf_tpr, label = 'Random Forest(area=%0.2f)'%rf_roc_auc)

# 决策树 ROC
plt.plot(dt_fpr,dt_tpr, label = 'Decision Tree(area=%0.2f)'%dt_roc_auc)

plt.xlim([0.0,1.0])
plt.ylim([0.0,1.05])
plt.xlabel('False Positive Rate')
plt.ylabel('True Positive Rate')
plt.title('ROC Graph')
plt.legend(loc="lower right")
plt.show()
所得结果:

分析不同特征的重要性
# 画出随机森林特征的重要性
importances = rf.feature_importances_
feat_names = data.drop(['Outcome'],axis = 1).columns

indices = np.argsort(importances)[::-1]

plt.figure(figsize=(12,6))
plt.title('Feature improtances by RandomForest')
plt.bar(range(len(indices)),importances[indices],color='lightblue', align='center')
plt.step(range(len(indices)),np.cumsum(importances[indices]),where='mid',label='Cumulative')
plt.xticks(range(len(indices)),feat_names[indices],rotation='vertical',fontsize=14)
plt.xlim([-1,len(indices)])
plt.show()
# 画出决策树的特征的重要性
importances = dtree.feature_importances_
feat_names = data.drop(['Outcome'],axis=1).columns
indices = np.argsort(importances)[::-1]
plt.figure(figsize=(12,6))
plt.title("Feature importances by Decision Tree")
plt.bar(range(len(indices)), importances[indices], color='lightblue',  align="center")
plt.step(range(len(indices)), np.cumsum(importances[indices]), where='mid', label='Cumulative')
plt.xticks(range(len(indices)), feat_names[indices], rotation='vertical',fontsize=14)
plt.xlim([-1, len(indices)])
plt.show()
欢迎指正与指点!