echarts重复加载
最近项目中用到 echarts,我们从数据库中得到数放到echarts中展示,一开始都是请求后直接放入数据,展示。没有问题,后来我们要求利用echarts根据图上的每一次点击事件,局部更新请求后台的数据,然后再展示,就不行了,非要点击事件,触发两次才可成功。
jsp 上的div (其中仅有style 和 id l两个属性):
js代码:
function chart() {
	var chart8 = echarts.init(document.getElementById("chart08"));
	chart.showLoading({
		text : '正在努力的读取数据中...'
	});
	option= {
		title : {
			text : 'XXXXXXX量',
			y : '0px'
		},
		tooltip : {
			trigger : 'axis'
		},
		legend : {
			data : def,
			y : '30px'
		},
		dataZoom : {
			show : true,
			start : 90,
			end : 100
		},
		toolbox : {
			show : true,
			orient : 'vertical',
			feature : {
				magicType : {
					show : true,
					type : [ 'line', 'bar' ]
				},
				restore : {
					show : true
				},
				saveAsImage : {
					show : true
				}
			}
		},
		calculable : true,
		xAxis : [ {
			type : 'category',
			data : []
		} ],
		yAxis : [ {
			type : 'value',
			axisLabel : {
				formatter : '{value} %'
			}


		} ],
		series : [ {
			symbol : "none",
			name : def[0],
			type : 'line',
			symbol : 'circle',
			smooth : true,
			data : []
		}, {
			symbol : "none",
			name : def[1],
			type : 'line',
			symbol : 'circle',
			smooth : true,
			data : []
		}, {
			symbol : "none",
			name : def[2],
			type : 'line',
			symbol : 'circle',
			smooth : true,
			data : []
		}, {
			symbol : "none",
			name : def[3],
			type : 'line',
			symbol : 'circle',
			smooth : true,
			data : []
		}, {
			symbol : "none",
			name : def[4],
			type : 'line',
			symbol : 'circle',
			smooth : true,
			data : []
		} ]
	};

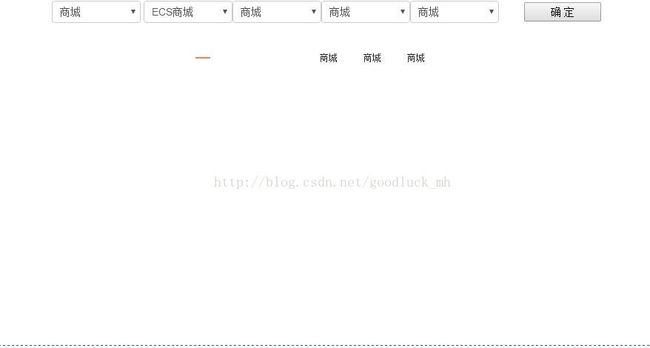
}但是后来我们要求加了一个按钮,实现动态局部刷新。于是产生了一开始是成功的,如上图所示:
但是如果再次的局部请求,就会出现空白:
然后不知为什么,找了半天,两次操作操作但结果不相同,的原因才找到,我通过浏览器的编译功能一步一步的debug模式下调试发现,option 要加入的div 属性有变化,(我用的google浏览器,个人觉得比较好用,F12 调试功能,找到Console 在旁边的数字列上打上桩,按F10 或F11 进行调试 js页面上的信息)。
315 行有错误信息,为了方便调试将其改为:
var div_ = document.getElementById("chart08");
chart8 = echarts.init(document.getElementById(div_));
在浏览器中点进 div_ 中查看其中的赋值和属性情况,图像展示出来之后F12 查看div_其中的内容:

发现与第一段代码段 id="chart08" 的div ,属性值有了变化,多出现了一个_echarts_instance_ 的属性,这难免让人怀疑是不是由它搞得鬼。
var chart8 = null;
	var div_ = document.getElementById("chart08");
	div_.removeAttribute("_echarts_instance_");
	chart8 = echarts.init(div_);
将 _echarts_instance_属性删除掉,再次执行,发现可以运行的很好了。点击一次出现一次。
结束语:虽然问题解决了,但是真正为什么会出现这种现象还是不太清楚,我在出图 和 不出图 两次运行上 每次查看div_ 其中的内容,没有发现前后两次的不同之处。也是没有向大家深入说明的原因。
还有遇到问题要善于利用工具,君子善假于物也。第一次写博文,错误之处在所难免,敬请高手指教。


