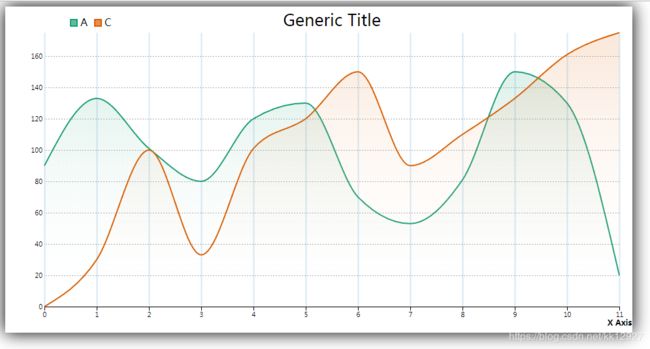
d3面积图(带显示值)
我们先将具体流程和源码展示出来,如果有自己想自定义改动的,最后将会讲出方法,以便不同的需求。
(一)具体展示
初始状态:
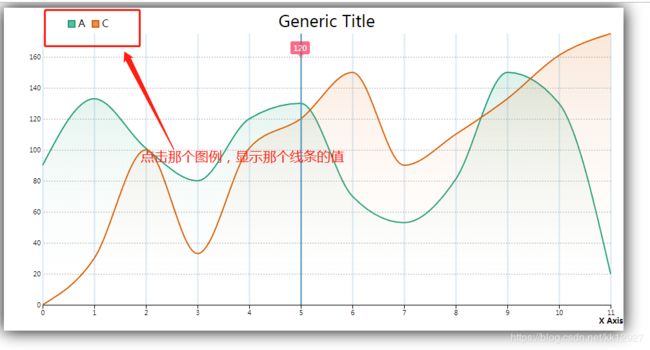
这里点击了A的图例现在显示A的值:

图例A和图例C都有值的情况下,点击那个图例,气泡显示的值就是那个。(这里气泡颜色可以换成,和显示线条的颜色统一,而且气泡现实内容可以自定义)
(二)源码
(底部可以直接下载源码)
CSS部分:
.classDiv {
		width: 30px;
		border-radius: 3px;
		height: 20px;
		line-height: 20px;
		color: #fff;
		text-align: center;
		background: rgb(246,43,83);
		font-size: 10px;
		opacity: 0.7;
	}

	.divEm {
		display: block;
		border-width: 5px;
		position: absolute;
		bottom: -10px;
		left: 11px;
		border-style: solid dashed dashed;
		border-color: rgb(246,43,83) transparent transparent;
		font-size: 0;
		line-height: 0;
		opacity: 0.7;
	}
HTML部分:
JS部分:
需要导入的JS文件 :d3.v5.js(与原本的V5不一样,实现气泡效果需要添加代码,因为气泡是由自己画上)
将普通的D3.v5爬取之后,把下面这个方法覆盖源码里的方法(大约在源码的210行左右,不过下面有源码链接,链接里的源码可以直接看到效果,无需更改其他代码):
function Y(t, n) {
		var e = [],
			r = null,
			i = null,
			o = 6,
			a = 6,
			u = 3,
			c = t === z || t === q ? -1 : 1,
			f = t === q || t === R ? "x" : "y",
			s = t === z || t === D ? U : O;
		var wa = -1;
		function l(l) {

			var h = null == r ? n.ticks ? n.ticks.apply(n, e) : n.domain() : r,
				d = null == i ? n.tickFormat ? n.tickFormat.apply(n, e) : P : i,
				p = Math.max(o, 0) + u,
				v = n.range(),
				g = +v[0] + .5,
				y = +v[v.length - 1] + .5,
				_ = (n.bandwidth ? function(t) {
					var n = Math.max(0, t.bandwidth() - 1) / 2;
					return t.round() && (n = Math.round(n)),
						function(e) {
							return +t(e) + n
						}
				} : function(t) {
					return function(n) {
						return +t(n)
					}
				})(n.copy()),
				b = l.selection ? l.selection() : l,
				m = b.selectAll(".domain").data([null]),
				x = b.selectAll(".tick").data(h, n).order(),
				w = x.exit(),
				M = x.enter().append("g").attr("class", "tick"),
				N = x.select("line"),
				A = x.select("text");
			m = m.merge(m.enter().insert("path", ".tick").attr("class", "domain").attr("stroke", "currentColor")), x = x.merge(
					M), N = N.merge(M.append("line").attr("stroke", "currentColor").attr(f + "2", c * o)), A = A.merge(M.append(
					"text").attr("fill", "#000").attr(f, c * p).attr("dy", t === z ? "0em" : t === D ? "0.71em" : "0.32em")),
				l !== b && (m = m.transition(l), x = x.transition(l), N = N.transition(l), A = A.transition(l), w = w.transition(l)
					.attr("opacity", L).attr("transform", function(t) {
						return isFinite(t = _(t)) ? s(t) : this.getAttribute("transform")
					}), M.attr("opacity", L).attr("transform", function(t) {
						var n = this.parentNode.__axis;
						return s(n && isFinite(n = n(t)) ? n : _(t))
					})), w.remove(), m.attr("d", t === q || t == R ? a ? "M" + c * a + "," + g + "H0.5V" + y + "H" + c * a : "M0.5," +
					g + "V" + y : a ? "M" + g + "," + c * a + "V0.5H" + y + "V" + c * a : "M" + g + ",0.5H" + y).attr("aaa","ww"), x.attr("opacity", 1)
				.attr("transform", function(t) {

					return s(_(t))
				}).attr('z-index',100).attr('name',function(){
					wa +=1;
					return "namekey" + wa;
				}), N.attr(f + "2", c * o), A.attr(f, c * p).text(d), b.filter(B).attr("fill", "none").attr("font-size", 10).attr(
					"font-family", "sans-serif").attr("text-anchor", t === R ? "start" : t === q ? "end" : "middle"), b.each(function() {
					this.__axis = _
				})
		}
		return l.scale = function(t) {
			return arguments.length ? (n = t, l) : n
		}, l.ticks = function() {
			return e = C.call(arguments), l
		}, l.tickArguments = function(t) {
			return arguments.length ? (e = null == t ? [] : C.call(t), l) : e.slice()
		}, l.tickValues = function(t) {
			return arguments.length ? (r = null == t ? null : C.call(t), l) : r && r.slice()
		}, l.tickFormat = function(t) {
			return arguments.length ? (i = t, l) : i
		}, l.tickSize = function(t) {
			return arguments.length ? (o = a = +t, l) : o
		}, l.tickSizeInner = function(t) {
			return arguments.length ? (o = +t, l) : o
		}, l.tickSizeOuter = function(t) {
			return arguments.length ? (a = +t, l) : a
		}, l.tickPadding = function(t) {
			return arguments.length ? (u = +t, l) : u
		}, l
	}
可更改JS部分(不是D3.v5源码):
var typeKey = "false";
		var clickTypeData = {};
		var data = [{
				key: 'a',
				values: [90, 133, 101, 80, 120, 130, 70, 53, 81, 150, 130, 20]
			},

			{
				key: 'c',
				values: [0, 30, 100, 33, 101, 120, 150, 90, 110, 133, 161, 175]
			}
		];
		clickTypeData = data;
		var margin = {
			left: 60,
			top: 40,
			right: 20,
			bottom: 40
		}
		var width = 960 - margin.left - margin.right,
			height = 500 - margin.top - margin.bottom,
			svg = d3.select('#mainDown').append('svg')
			.attr('width', width + margin.left + margin.right)
			.attr('height', height + margin.top + margin.bottom)
			.style('box-shadow', '0px 0px 25px')
			.style('margin', 'auto')
			.append('g')
			.attr('transform', 'translate(' + [margin.left, margin.top] + ')')

		var x = d3.scaleLinear()
			.range([0, width])
			.domain([0, data[0].values.length - 1])
		var y = d3.scaleLinear()
			.range([height, 0])
			.domain([0, d3.max(data, d => d3.max(d.values, v => v))])
		var area = d3.area()
			.x((d, i) => x(i))
			.y0(y(0))
			.y1(d => y(d))
			.curve(d3.curveMonotoneX)
		var line = d3.line()
			.x((d, i) => x(i))
			.y(d => y(d))
			.curve(d3.curveMonotoneX)
		var color = d3.scaleOrdinal(d3.schemeDark2)
		color.domain(data.map(d => d.key))

		var title = svg.append('text')
			.text('Generic Title')
			.attr('x', width / 2)
			.attr('y', -10)
			.attr('font-size', 25)
			.attr('text-anchor', 'middle')

		var legend = svg.selectAll('g.legendItems')
			.data(color.domain())
			.enter().append('g')
			.attr('class', d => 'legendItems ' + d)
			.style('cursor', 'pointer')
			.on('mouseover', (a, b, c) => mouseOver(a, b, c))
			.on('mouseout', (a, b, c) => mouseOut(a, b, c))
			.on('click', (a, b, c) => click(a, b, c))
		legend.append('rect')
			.attr('width', 10)
			.attr('height', 10)
			.attr('stroke', function(d) {
				return color(d);
			})
			.attr('stroke-width', 2)
			.attr('fill', function(d) {
				return color(d);
			})
			.attr('fill-opacity', .7);
		legend.append('text')
			.text(function(d) {
				return d.replace(/^\w/, c => c.toUpperCase());
			})
			.attr('x', 15)
			.attr('y', 10);

		var moveLegend = 0;
		legend.each(function(g) {
			var gDiv = svg.select('g.' + g.replace(/\s|\//, ''));
			var gWidth = gDiv.node().getBoundingClientRect().width + 10;
			moveLegend += gWidth;
			gDiv.attr('transform', 'translate(' + [(moveLegend - gWidth) + 40, -20] + ')');
		});

		var defs = svg.append('defs')
		var lineGrads = defs.selectAll("linearGradient")
			.data(color.domain())
			.enter().append('linearGradient')
			.attr("id", d => d)
			.attr("x2", "0%")
			.attr("y2", "100%");

		lineGrads.append("stop")
			.attr('class', 'start')
			.attr("offset", "0%")
			.attr("stop-color", d => color(d))
			.attr('stop-opacity', .15)

		lineGrads.append("stop")
			.attr('class', 'end')
			.attr("offset", "100%")
			.attr("stop-color", '#fff')
			.attr('stop-opacity', 0)

		svg.append('g')
			.attr('transform', 'translate(0,' + height + ')')
			.call(d3.axisBottom(x))
			.call(g => {
				g.select('.tick:last-of-type text').clone()
					.attr('y', 20)
					.attr('text-anchor', 'middle')
					.attr('font-weight', 'bold')
					.attr('font-size', 12)
					.text('X Axis')
			})
		svg.append('g')
			.attr('transform', 'translate(' + width + ',0)')
			.call(d3.axisLeft(y).tickSize(width))
			.call(g => {
				g.select('.domain').remove()
				g.selectAll('line')
					.attr('stroke', '#aaa')
					.attr("stroke-dasharray", "2,2");
				g.select('.tick:last-of-type text').clone()
					.attr('y', -40)
					.attr('text-anchor', 'middle')
					.attr('font-weight', 'bold')
					.attr('font-size', 12)
					.attr('transform', 'rotate(-90)')
					.text('Y Axis')
				g.select('.tick:first-of-type line').remove()
			});


		var areas = svg.selectAll('g.area')
			.data(data)
			.enter().append('g')
			.attr('class', d => 'area ' + d.key)

		var ease = d3.easeQuad

		var lines = areas.append('path')
			.attr('class', 'linePath')
			.datum(d => d)
			.attr('d', d => line(new Array(d.values.length).fill(0)))
			.transition().delay((d, i) => 150 * i)
			.ease(ease)
			.attr('d', d => line(d.values))
			.attr('fill', 'none')
			.attr('stroke', d => color(d.key))
			.attr('stroke-width', 2)
		areas.append('path')
			.attr('class', 'areaPath')
			.datum(d => d)
			.attr('d', d => area(new Array(d.values.length).fill(0)))
			.transition().delay((d, i) => 150 * i)
			.ease(ease)
			.attr('d', d => area(d.values))
			.attr('fill', d => 'url(#' + d.key + ')')

		svg.append('g')
			.attr('transform', 'translate(0,0)')
			.attr('fill', '#ccc')
			.attr('z-index', 100)
			.attr('stroke-width', 2)
			.call(d3.axisBottom(x).tickSize(height).ticks(11))
			.attr('class', 'setColor')
			.call(g => {
				g.select('.domain').remove().attr('z-index', 100)
				g.selectAll('line')
					.attr('stroke', 'rgb(67,142,185)')
					.attr('opacity', .2)
					.attr('z-index', 100)
				g.selectAll('text')
					.attr("fill", "transparent")
			})
			.on("mouseover", g => {
				var e = e || window.event;
				init(e);
			})
		//
		//绘制气泡位置
		var clickTypeData_values;
		let init = (e) => {
			clickTypeData.forEach((item, i) => {
				if (typeKey == clickTypeData[i].key) {
					clickTypeData_values = clickTypeData[i].values;
				}
			})
			if (typeKey != "false") {
				e.path[0].setAttribute("opacity", 1);
				e.path[0].setAttribute("style", `border:1px solid red;width:5px`);
				let vals = e.path[0].parentNode.getAttribute('transform');
				let valName = e.path[0].parentNode.getAttribute('name');
				valName = valName.split('y')[1];
				let id = document.getElementById("mainDown");
				let childSpan = document.createElement("div");
				let childEm = document.createElement("em");
				let pxS = vals.split(",");

				pxS = pxS[0].split('(');
				pxS = parseInt(pxS[1]) + 52;
				childSpan.setAttribute('class', "classDiv");
				childSpan.setAttribute('style', `pointer-events: none;Position:absolute;left:${pxS}px;top:60px`);
				childSpan.innerText = initValue(typeKey, clickTypeData_values[valName]);
				childEm.setAttribute('class', 'divEm');
				childSpan.appendChild(childEm);
				id.appendChild(childSpan);
				e.path[0].addEventListener("mouseout", function() {
					setTimeout(function() {
						e.path[0].setAttribute("opacity", 0.2);
						id.removeChild(childSpan);
					}, 100)
				}, false);
			}
		}
		// 		//获取气泡显示值
		let initValue = (type, key) => {
			return key
		}

		function mouseOver(a, b, c) {
			color.domain().filter(d => d != a)
				.forEach(d => {
					svg.select('g.area.' + d)
						.transition()
						.style('opacity', .2)
				})
		}

		function mouseOut(a, b, c) {
			svg.selectAll('g.area')
				.transition()
				.style('opacity', 1)
		}

		function click(a, b, c) {
			typeKey = a;
			if (d3.select(c[b]).classed('clicked')) {
				d3.select(c[b]).classed('clicked', false)
					.select('rect').attr('fill', '#bbb')
				c.filter(d => d != c[b] && d3.select(d).classed('clicked'))
					.forEach(d => {
						d3.select(d).select('rect')
							.attr('fill', v => color(v))
					})

				var filter = c.filter(d => !d3.select(d).classed('clicked'))
				if (filter.length === c.length) {
					filter.forEach(d => {
						d3.select(d).select('rect')
							.attr('fill', d => color(d))
						var singleArea = d3.select('g.area.' + d3.select(d).data())
						singleArea.select('.areaPath').transition()
							.ease(ease)
							.attr('d', d => area(d.values))

						singleArea.select('.linePath').transition()
							.ease(ease)
							.attr('d', d => line(d.values))

					})
				} else {
					filter.forEach(d => {
						d3.select(d).select('rect')
							.attr('fill', '#bbb')
						var singleArea = d3.select('g.area.' + d3.select(d).data())
						singleArea.select('.areaPath').transition()
							.ease(ease)
							.attr('d', d => area(new Array(d.values.length).fill(0)))

						singleArea.select('.linePath').transition()
							.ease(ease)
							.attr('d', d => line(new Array(d.values.length).fill(0)))

					})
				}
			} else {
				d3.select(c[b]).classed('clicked', true)
				d3.select(c[b]).select('rect').attr('fill', v => color(v))
				c.filter(d => d != c[b] && !d3.select(d).classed('clicked'))
					.forEach(d => {
						d3.select(d).select('rect')
							.attr('fill', '#bbb')
						var singleArea = d3.select('g.area.' + d3.select(d).data())
						singleArea.select('.areaPath').transition()
							.ease(ease)
							.attr('d', d => area(new Array(d.values.length).fill(0)))

						singleArea.select('.linePath').transition()
							.ease(ease)
							.attr('d', d => line(new Array(d.values.length).fill(0)))

					})
				c.filter(d => d3.select(d).classed('clicked'))
					.forEach(d => {
						var singleArea = d3.select('g.area.' + d3.select(d).data())
						singleArea.select('.areaPath').transition()
							.ease(ease)
							.attr('d', d => area(d.values))

						singleArea.select('.linePath').transition()
							.ease(ease)
							.attr('d', d => line(d.values))

					})
			}
		}
其中气泡主要的代码都在init()方法之中,样式也是随意可以换的,如果图的大小不同引起气泡出现位置不对,pxS = parseInt(pxS[1]) + 52(自定义更改大小调整图片距离)。
childSpan.setAttribute(‘style’, pointer-events: none;Position:absolute;left:${pxS}px;top:60px);这句是定义气泡位置的地方。气泡的样式也是由CSS部分控制,可以设定自己需要的样式。
下载源码:https://github.com/Ckkkxx/D3
需要更改找不到地方的可以留言