基于 Echarts + Python 实现的动态实时可视化数据大屏展示范例四
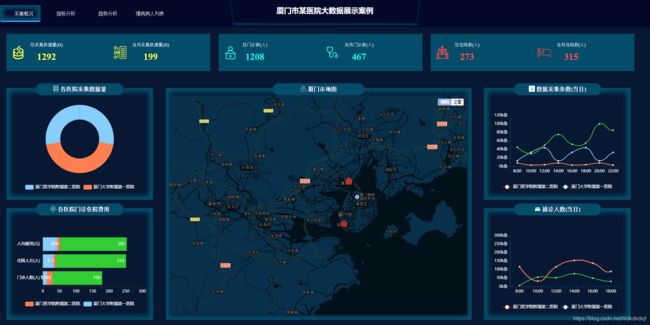
近年来,数据可视化大屏的出现,掀起一番又一番的浪潮,众多企业主纷纷想要打造属于自己的 “酷炫吊炸天” 的霸道总裁大屏驾驶舱。今天为大家分享的是 【厦门市某医院大数据展示案例】。
话不多说,开始分享干货,欢迎讨论!QQ微信同号: 6550523
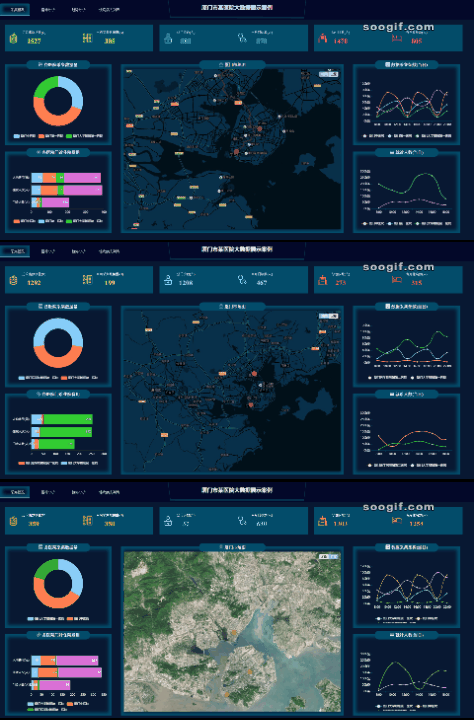
首先看动态效果图 :
再看实时分片数据图:
一、 确定需求方案
1、确定产品上线部署的屏幕LED分辨率
1280px*768px,F11全屏后占满整屏且无滚动条;其它分辨率屏幕均可自适应显示。
2、功能模块
- 总采集数据量
- 当月采集数据量
- 总门诊数
- 当月门诊数
- 总住院数
- 当月住院数
- 各医院采集数据量
- 各医院门诊住院费用
-
厦门市地图
-
数据采集条数(当日)
-
就诊人数(当日)
3、部署方式
- 基于免安装可执行程序:支持Windows、Linux、Mac等各种主流操作系统;将可执行程序exe复制到服务器上即可,无需其它环境依赖;
- 观看方式:既可在服务器上直接观看程序界面,也可远程使用浏览器打开播放,支持Chrome浏览器、360浏览器等主流浏览器。
二、整体架构设计
- 前端基于Echarts开源库设计,使用WebStorm编辑器;
- 后端基于Python Web实现,使用Pycharm编辑器;
- 数据传输格式:JSON;
- 数据源类型:目前已支持PostgreSQL、MySQL、Oracle、Microsoft SQL Server、SQLite、Excel表格等,还可以定制HTTP API接口方式或其它类型数据库。
- 数据更新方式:摒弃了前端页面定时拉取的方式(这种方式带来严重的资源浪费),采用后端数据实时更新,实时推送到前端展示;
三、编码实现 (基于篇幅及可读性考虑,此处展示部分关键代码)
- 前端html代码
数据可视化demo 厦门市某医院大数据展示案例

总采集数据量(G)
1235

当月采集数据量(G)
235

总门诊数(人)
12356

当月门诊数(人)
12356

总住院数(人)
12356

当月住院数(人)
12356
 各医院采集数据量
 各医院门诊住院费用
 厦门市地图
厦门市地图  数据采集条数(当日)
 就诊人数(当日)第一医院
 门诊住院人次
 医疗费用
医疗费用 病人年龄段分布
 医疗费用组成
 - 前端JS代码
var symptomName = last_month_day(); $(function(){ init(); init2(); $("#el-dialog").addClass("hide"); $(".close").click(function(event) { $("#el-dialog").addClass("hide"); }); var date = new Date(); var numble = date.getDate(); var today = getFormatMonth(new Date()); $("#date1").html(today); $("#date2").html(today); $("#date3").html(today); $("#date4").html(today); lay('.demo-input').each(function(){ laydate.render({ type: 'month', elem: this, trigger: 'click', theme: '#95d7fb', calendar: true, showBottom: true, done: function () { console.log( $("#startDate").val()) } }) }); }) function init(){ //地图 var mapChart = echarts.init(document.getElementById('mapChart')); mapChart.setOption({ bmap: { center: [118.104103,24.477761], zoom: 15, roam: true, }, tooltip : { trigger: 'item', formatter:function(params, ticket, callback){ console.log(params) return params.value[2] + ":
" + params.value[3] } }, series: [{ type: 'scatter', coordinateSystem: 'bmap', symbolSize: 20, data: [ [118.096435, 24.485408, '厦门市'] , [118.094564, 24.457358, '厦门第一医院'] , [118.104103, 24.477761, '厦门中山医院'], [118.14748, 24.506295, '厦门中医院'], [118.254841, 24.665349, '厦门第五医院'], ] }] }); mapChart.on('click', function (params) { $("#el-dialog").removeClass('hide'); $("#reportTitle").html(params.value[2]); }); var bmap = mapChart.getModel().getComponent('bmap').getBMap() bmap.addControl(new BMap.MapTypeControl({mapTypes: [BMAP_NORMAL_MAP,BMAP_SATELLITE_MAP ]})); bmap.setMapStyle({style:'midnight'}) var pieChart1 = echarts.init(document.getElementById('pieChart1')); pieChart1.setOption({ color:["#87cefa","#ff7f50","#32cd32","#da70d6",], legend: { y : '260', x : 'center', textStyle : { color : '#ffffff', }, data : ['厦门第一医院','厦门中山医院','厦门中医院','厦门第五医院',], }, tooltip : { trigger: 'item', formatter: "{a}
{b}
{c}G ({d}%)" }, calculable : false, series : [ { name:'采集数据量', type:'pie', radius : ['40%', '70%'], center : ['50%', '45%'], itemStyle : { normal : { label : { show : false }, labelLine : { show : false } }, emphasis : { label : { show : true, position : 'center', textStyle : { fontSize : '20', fontWeight : 'bold' } } } }, data:[ {value:335, name:'厦门第一医院'}, {value:310, name:'厦门中山医院'}, {value:234, name:'厦门中医院'}, {value:135, name:'厦门第五医院'} ] } ] }); var lineChart = echarts.init(document.getElementById('lineChart')); lineChart.setOption({ color:["#87cefa","#ff7f50","#32cd32","#da70d6",], legend: { y : '260', x : 'center', textStyle : { color : '#ffffff', }, data : ['厦门第一医院','厦门中山医院','厦门中医院','厦门第五医院',], }, calculable : false, tooltip : { trigger: 'item', formatter: "{a}
{b}
{c}条" }, yAxis: [ { type: 'value', axisLine : {onZero: false}, axisLine:{ lineStyle:{ color: '#034c6a' }, }, axisLabel: { textStyle: { color: '#fff' }, formatter: function (value) { return value + "k条" }, }, splitLine:{ lineStyle:{ width:0, type:'solid' } } } ], xAxis: [ { type: 'category', data : ['8:00','10:00','12:00','14:00','16:00','18:00','20:00','22:00'], axisLine:{ lineStyle:{ color: '#034c6a' }, }, splitLine: { "show": false }, axisLabel: { textStyle: { color: '#fff' }, formatter: function (value) { return value + "" }, }, splitLine:{ lineStyle:{ width:0, type:'solid' } }, } ], grid:{ left: '5%', right: '5%', bottom: '20%', containLabel: true }, series : [ { name:'厦门第一医院', type:'line', smooth:true, itemStyle: { normal: { lineStyle: { shadowColor : 'rgba(0,0,0,0.4)' } } }, data:[15, 0, 20, 45, 22.1, 25, 70, 55, 76] }, { name:'厦门中山医院', type:'line', smooth:true, itemStyle: { normal: { lineStyle: { shadowColor : 'rgba(0,0,0,0.4)' } } }, data:[25, 10, 30, 55, 32.1, 35, 80, 65, 76] }, { name:'厦门中医院', type:'line', smooth:true, itemStyle: { normal: { lineStyle: { shadowColor : 'rgba(0,0,0,0.4)' } } }, data:[35, 20, 40, 65, 42.1, 45, 90, 75, 96] }, { name:'厦门第五医院', type:'line', smooth:true, itemStyle: { normal: { lineStyle: { shadowColor : 'rgba(0,0,0,0.4)' } } }, data:[45, 30, 50, 75, 52.1, 55, 100, 85, 106] } ] }); var histogramChart = echarts.init(document.getElementById('histogramChart')); histogramChart.setOption({ color:["#87cefa","#ff7f50","#32cd32","#da70d6",], legend: { y : '250', x : 'center', data:['厦门第一医院', '厦门中山医院','厦门中医院','厦门第五医院'], textStyle : { color : '#ffffff', } }, calculable :false, grid:{ left: '5%', right: '5%', bottom: '20%', containLabel: true }, tooltip : { trigger: 'axis', axisPointer : { type : 'shadow' } }, xAxis : [ { type : 'value', axisLabel: { show: true, textStyle: { color: '#fff' } }, splitLine:{ lineStyle:{ color:['#f2f2f2'], width:0, type:'solid' } } } ], yAxis : [ { type : 'category', data:['门诊人数(人)', '住院人次(人)','人均费用(元)'], axisLabel: { show: true, textStyle: { color: '#fff' } }, splitLine:{ lineStyle:{ width:0, type:'solid' } } } ], series : [ { name:'厦门第一医院', type:'bar', stack: '总量', itemStyle : { normal: {label : {show: true, position: 'insideRight'}}}, data:[320, 302, 301] }, { name:'厦门中山医院', type:'bar', stack: '总量', itemStyle : { normal: {label : {show: true, position: 'insideRight'}}}, data:[120, 132, 101] }, { name:'厦门中医院', type:'bar', stack: '总量', itemStyle : { normal: {label : {show: true, position: 'insideRight'}}}, data:[220, 182, 191] }, { name:'厦门第五医院', type:'bar', stack: '总量', itemStyle : { normal: {label : {show: true, position: 'insideRight'}}}, data:[150, 212, 201] } ] }); var lineChart2 = echarts.init(document.getElementById('lineChart2')); lineChart2.setOption({ color:["#87cefa","#ff7f50","#32cd32","#da70d6",], legend: { y : '260', x : 'center', textStyle : { color : '#ffffff', }, data : ['厦门第一医院','厦门中山医院','厦门中医院','厦门第五医院',], }, calculable : false, tooltip : { trigger: 'item', formatter: "{a}
{b}
{c}条" }, yAxis: [ { type: 'value', axisLine : {onZero: false}, axisLine:{ lineStyle:{ color: '#034c6a' }, }, axisLabel: { textStyle: { color: '#fff' }, formatter: function (value) { return value + "k条" }, }, splitLine:{ lineStyle:{ width:0, type:'solid' } } } ], xAxis: [ { type: 'category', data : ['8:00','10:00','12:00','14:00','16:00','18:00'], axisLine:{ lineStyle:{ color: '#034c6a' }, }, splitLine: { "show": false }, axisLabel: { textStyle: { color: '#fff' }, formatter: function (value) { return value + "" }, }, splitLine:{ lineStyle:{ width:0, type:'solid' } }, } ], grid:{ left: '5%', right: '5%', bottom: '20%', containLabel: true }, series : [ { name:'厦门第一医院', type:'line', smooth:true, itemStyle: { normal: { lineStyle: { shadowColor : 'rgba(0,0,0,0.4)' } } }, data:[15, 0, 20, 45, 22.1, 25,].reverse() }, { name:'厦门中山医院', type:'line', smooth:true, itemStyle: { normal: { lineStyle: { shadowColor : 'rgba(0,0,0,0.4)' } } }, data:[25, 10, 30, 55, 32.1, 35, ].reverse() }, { name:'厦门中医院', type:'line', smooth:true, itemStyle: { normal: { lineStyle: { shadowColor : 'rgba(0,0,0,0.4)' } } }, data:[35, 20, 40, 65, 42.1, 45, ].reverse() }, { name:'厦门第五医院', type:'line', smooth:true, itemStyle: { normal: { lineStyle: { shadowColor : 'rgba(0,0,0,0.4)' } } }, data:[45, 30, 50, 75, 52.1, 55, 6].reverse() } ] }); } function init2(){ var lineChart3 = echarts.init(document.getElementById('lineChart3')); lineChart3.setOption({ color:["#87cefa","#ff7f50",], legend: { y : 'top', x : 'center', textStyle : { color : '#ffffff', }, data : ['门诊人次','住院人次'], }, calculable : false, tooltip : { trigger: 'item', formatter: "{a}
{b}
{c}人" }, dataZoom: { show: true, realtime : true, start: 0, end: 18, height: 20, backgroundColor: '#f8f8f8', dataBackgroundColor: '#e4e4e4', fillerColor: '#87cefa', handleColor: '#87cefa', }, yAxis: [ { type: 'value', axisLine : {onZero: false}, axisLine:{ lineStyle:{ color: '#034c6a' }, }, axisLabel: { textStyle: { color: '#fff' }, formatter: function (value) { return value + "人" }, }, splitLine:{ lineStyle:{ width:0, type:'solid' } } } ], xAxis: [ { type: 'category', data : symptomName, boundaryGap : false, axisLine:{ lineStyle:{ color: '#034c6a' }, }, splitLine: { "show": false }, axisLabel: { textStyle: { color: '#fff' }, formatter: function (value) { return value + "" }, }, splitLine:{ lineStyle:{ width:0, type:'solid' } }, } ], grid:{ left: '5%', right: '5%', bottom: '20%', containLabel: true }, series : [ { name:'门诊费用', type:'line', smooth:true, itemStyle: { normal: { lineStyle: { shadowColor : 'rgba(0,0,0,0.4)' } } }, data:[1150, 180, 2100, 2415, 1212.1, 3125,1510, 810, 2100, 2415, 1122.1, 3215,1510, 801, 2001, 2245, 1232.1, 3245,1520, 830, 2200, 2145, 1223.1, 3225,150, 80, 200, 245, 122.1, 325] }, { name:'住院费用', type:'line', smooth:true, itemStyle: { normal: { lineStyle: { shadowColor : 'rgba(0,0,0,0.4)' } } }, data:[2500, 1000, 3000, 5005, 3200.1, 3005, 2500, 1000, 3000, 5005, 3200.1, 3005,2500, 1000, 3000, 5005, 3200.1, 3005,2500, 1000, 3000, 5005, 3200.1, 3005, 2500, 1000, 3000, 5005, 3200.1, 3005,2500, 1000, 3000, 5005, 3200.1, 3005,] }, ] }); var lineChart4 = echarts.init(document.getElementById('lineChart4')); lineChart4.setOption({ color:["#87cefa","#ff7f50",], calculable : false, tooltip : { trigger: 'item', formatter: "{a}
{b}
{c}元" }, dataZoom: { show: true, realtime : true, start: 0, end: 18, height: 20, backgroundColor: '#f8f8f8', dataBackgroundColor: '#e4e4e4', fillerColor: '#87cefa', handleColor: '#87cefa', }, yAxis: [ { type: 'value', axisLine : {onZero: false}, axisLine:{ lineStyle:{ color: '#034c6a' }, }, axisLabel: { textStyle: { color: '#fff' }, formatter: function (value) { return value + "元" }, }, splitLine:{ lineStyle:{ width:0, type:'solid' } } } ], xAxis: [ { type: 'category', data : symptomName, boundaryGap : false, axisLine:{ lineStyle:{ color: '#034c6a' }, }, splitLine: { "show": false }, axisLabel: { textStyle: { color: '#fff' }, formatter: function (value) { return value + "" }, }, splitLine:{ lineStyle:{ width:0, type:'solid' } }, } ], grid:{ left: '5%', right: '5%', bottom: '20%', containLabel: true }, series : [ { name:'医疗费用', type:'line', smooth:true, itemStyle: { normal: { lineStyle: { shadowColor : 'rgba(0,0,0,0.4)' } } }, data:[1500, 800, 1200, 2450, 1122.1, 1325,1150, 180, 1200, 1245, 1122.1, 1325,150, 180, 1200, 2145, 1212.1, 3215,1510, 180, 2100, 2415, 122.1, 325,150, 80, 200, 245, 122.1, 325].reverse() }, ] }); //年龄分布 var pieChart2 = echarts.init(document.getElementById('pieChart2')); pieChart2.setOption({ color:["#32cd32","#ff7f50","#87cefa","#FD6C88","#4b5cc4","#faff72"], tooltip : { trigger: 'item', formatter: "{a}
{b}
{c}人" }, calculable : true, series : [ { name:'发病人数', type:'pie', radius : [30, 110], center : ['50%', '50%'], roseType : 'area', x: '50%', sort : 'ascending', data:[ {value:10, name:'婴儿(1-3岁)'}, {value:5, name:'少儿(4-10岁)'}, {value:15, name:'少年(10-18岁)'}, {value:25, name:'青年(18-45岁)'}, {value:125, name:'中年(45-60岁)'}, {value:175, name:'老年(60岁以上)'}, ] } ] }) //医疗费用组成 var pieChart3 = echarts.init(document.getElementById('pieChart3')); pieChart3.setOption({ color:["#32cd32","#ff7f50","#87cefa","#FD6C88","#4b5cc4","#faff72"], tooltip : { trigger: 'item', formatter: "{a}
{b}
{c}元" }, calculable : true, series : [ { name:'发病人数', type:'pie', radius : [30, 110], center : ['50%', '50%'], roseType : 'area', x: '50%', sort : 'ascending', data:[ {value:10, name:'诊察费用'}, {value:500, name:'检查费用'}, {value:150, name:'检验费用'}, {value:250, name:'西药费用'}, {value:125, name:'中药费用'}, {value:1750, name:'手术费用'}, ] } ] }) } var chartMapElementId = 'mapChart'; // var chartMapElement = document.getElementById(chartMapElementId); 这种有问题,不显示图 //相对路径,页面的当前目录 // var jsonFileName = 'json/map.json'; //绝对路径,根目录 var jsonFileName = '/json/map.json'; var jsonFileNamechart_1 = '/json/chart_1.json'; var jsonFileNamechart_2 = '/json/chart_2.json'; function get_legend(data) { var listLegend = new Array(); for (i=0; i - 后端python代码
# -*- coding:utf-8 -*-

import io
import os
import shutil
import sys
import urllib
import json
from http.server import HTTPServer, SimpleHTTPRequestHandler, ThreadingHTTPServer

ip = "localhost"   # 监听IP,配置项
port = 8811       # 监听端口,配置项
index_url = "http://%s:%d/views/index.html" %(ip, port)  # 监听主页url,配置项

# C:\Users\zll\AppData\Local\python  缓存目录,shit

class MyRequestHandler(SimpleHTTPRequestHandler):
    protocol_version = "HTTP/1.0"
    server_version = "PSHS/0.1"
    sys_version = "Python/3.7.x"
    target = "./"  # 监听目录,配置项

    def do_GET(self):
        if self.path.find("/json/") > 0:
            print(self.path)
            req = {"success": "true"}
            self.send_response(200)
            self.send_header("Content-type", "json")
            self.end_headers()
            with open(self.path, 'r', encoding="utf-8") as f:
                data = json.load(f)
                rspstr = json.dumps(data)
                self.wfile.write(rspstr.encode("utf-8"))

        else:
            SimpleHTTPRequestHandler.do_GET(self);

    def do_POST(self):
        if self.path == "/signin":
            print("postmsg recv, path right")
        else:
            print("postmsg recv, path error")
            data = self.rfile.read(int(self.headers["content-length"]))
            data = json.loads(data)
            self.send_response(200)
            self.send_header("Content-type", "text/html")
            self.end_headers()
            rspstr = "recv ok, data = "
            rspstr += json.dumps(data, ensure_ascii=False)
            self.wfile.write(rspstr.encode("utf-8"))

def del_dir(filepath):
    """
    删除某一目录下的所有文件或文件夹
    :param filepath: 路径
    :return:
    """
    del_list = os.listdir(filepath)
    for f in del_list:
        file_path = os.path.join(filepath, f)
        if os.path.isfile(file_path):
            os.remove(file_path)
        elif os.path.isdir(file_path):
            shutil.rmtree(file_path)

def HttpServer():
    try:
        cache = "C:/Users/zll/AppData/Local/python/cache"
        del_dir(cache)
        server = HTTPServer((ip, port), MyRequestHandler)
        print("服务器监听地址: ", index_url)
        server.serve_forever()
    except KeyboardInterrupt:
        server.socket.close()
四、上线运行
本次分享结束,欢迎讨论!QQ微信同号: 6550523
感谢:本项目引用了互联网大牛的前端代码,然后定制开发实现了后端服务器,最终实现了可视化大屏的完整方案。


