8. 随机超参搜索(The caret package)
1. 简介(The caret package )
2. 可视化(The caret package)
3. 预处理(The caret package)
4. 数据分割(The caret package)
5. 模型训练和调参(The caret package)
6. 可用模型(The caret package )
7. train的模型标签
8. 随机超参搜索
在train中优化参数的默认方法是使用网格搜索。这种方法通常是有效的,但是,在有很多参数要调整的时候,他可能不那么有效。另一种方法是用参数组合的随机选择来遍历参数空间。
有很多模型,用这种方法在相对短的时间内找到参数的合理值。然而,有一些模型,在小的搜索区域中能抵消其他的优化。例如,在caret包中的一些模型使用“子模型技巧”,在这“子模型技巧”中M个参数组合被估计,但是可能需要的拟合估计远小于这M个模型。当使用一个简单的网格搜索时,这种方法是最好的原型。由于这个原因,对于下列模型方法,用随机搜索可能不那么有效:
ada, AdaBag, AdaBoost.M1, bagEarth, blackboost, blasso, BstLm, bstSm, bstTree, C5.0, C5.0Cost, cubist, earth, enet, foba, gamboost, gbm, glmboost, glmnet, kernelpls, lars, lars2, lasso, lda2, leapBackward, leapForward, leapSeq, LogitBoost, pam, partDSA, pcr, PenalizedLDA, pls, relaxo, rfRules, rotationForest, rotationForestCp, rpart, rpart2, rpartCost, simpls, spikeslab, superpc, widekernelpls, xgbTree.
最终,由train包装的许多模型有很少的参数,平均参数有1.8个。
要使用随机搜索方法,另一个选择,即trainControl中的search是可以使用的。这个参数的可能取值为grid和random。caret包内置的模型包含一些代码去产生随机参数的组合。总的不同组合的数量有train中的参数tuneLength`设定。
再一次我们使用Sonar数据,通过查看30个参数组合来描述规则判别分析。
library(mlbench)
data(Sonar)

library(caret)
set.seed(998)
inTraining <- createDataPartition(Sonar$Class, p = .75, list = FALSE)
training <- Sonar[ inTraining,]
testing  <- Sonar[-inTraining,]

fitControl <- trainControl(method = "repeatedcv",
                           number = 10,
                           repeats = 10,
                           classProbs = TRUE,
                           summaryFunction = twoClassSummary,
                           search = "random")

set.seed(825)
rda_fit <- train(Class ~ ., data = training,
                  method = "rda",
                  metric = "ROC",
                  tuneLength = 30,
                  trControl = fitControl)
rda_fit
## Regularized Discriminant Analysis
##
## 157 samples
##  60 predictor
##   2 classes: 'M', 'R'
##
## No pre-processing
## Resampling: Cross-Validated (10 fold, repeated 10 times)
## Summary of sample sizes: 142, 142, 140, 142, 142, 141, ...
## Resampling results across tuning parameters:
##
##   gamma       lambda      ROC        Sens       Spec
##   0.03989739  0.90079034  0.8876811  0.8459722  0.7667857
##   0.04968076  0.92570716  0.8816245  0.8425000  0.7610714
##   0.07268784  0.24747192  0.9153125  0.8893056  0.8107143
##   0.15727695  0.92403079  0.8842262  0.8636111  0.7696429
##   0.18095571  0.19419752  0.9138318  0.8895833  0.7907143
##   0.25251704  0.59742978  0.9184152  0.9254167  0.7891071
##   0.29954232  0.63759620  0.9133681  0.9169444  0.7710714
##   0.31520463  0.96521251  0.8743998  0.8511111  0.7773214
##   0.33009668  0.81815445  0.8950967  0.8937500  0.7746429
##   0.36085613  0.75063821  0.8999231  0.9056944  0.7658929
##   0.36447104  0.04755168  0.8947321  0.8726389  0.7500000
##   0.38014796  0.81490324  0.8939087  0.8901389  0.7648214
##   0.42198667  0.94140042  0.8776984  0.8508333  0.7801786
##   0.42208259  0.20124965  0.9042262  0.8863889  0.7526786
##   0.43249714  0.41644166  0.9075818  0.8958333  0.7641071
##   0.43342775  0.24999664  0.9047173  0.8898611  0.7598214
##   0.49307138  0.20539733  0.8989608  0.8897222  0.7503571
##   0.50624038  0.06571280  0.8952133  0.8794444  0.7444643
##   0.51244277  0.52918233  0.9032813  0.9000000  0.7444643
##   0.54605138  0.44369088  0.9007292  0.8916667  0.7428571
##   0.56784496  0.37966361  0.8992882  0.8931944  0.7419643
##   0.58229517  0.15112209  0.8933135  0.8776389  0.7423214
##   0.69886586  0.18057206  0.8876314  0.8825000  0.7244643
##   0.70747426  0.02153708  0.8836111  0.8740278  0.7232143
##   0.70986464  0.02730106  0.8839286  0.8752778  0.7217857
##   0.71609215  0.98811552  0.8544147  0.7781944  0.7617857
##   0.74102544  0.88861156  0.8634003  0.8097222  0.7433929
##   0.77714849  0.94955834  0.8504812  0.7794444  0.7433929
##   0.89569896  0.81051218  0.8287773  0.7795833  0.7067857
##   0.93822474  0.10278451  0.8341741  0.8397222  0.6810714
##
## ROC was used to select the optimal model using  the largest value.
## The final values used for the model were gamma = 0.252517 and lambda
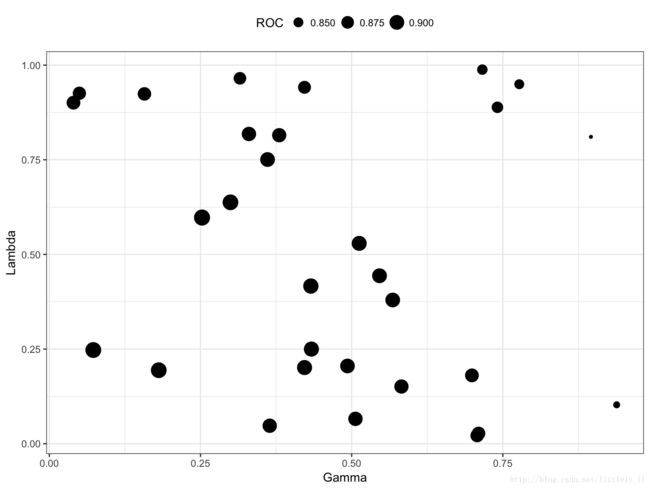
## = 0.5974298.这儿仅有一个ggplot方法,带有随机搜索的函数的结果依赖于参数的个数和类型。在这个例子中,它生成了一个连续参数的散点图。
ggplot(rda_fit) + theme(legend.position = "top")