三维重建
微信公众号:小白图像与视觉
关于技术、关注yysilence00。有问题或建议,请公众号留言。
只是找个地说会话
#2.综述
- 本示例说明如何从使用通过Camera Calibrator应用程序校准的摄像机拍摄的一对2D图像中重建3D场景。该算法包括以下步骤:
1、在两个图像之间匹配一组稀疏点。查找两个图像之间的点对应关系的方法有多种。本示例使用detectMinEigenFeatures函数检测第一张图像中的角,并将其跟踪到第二张图像中vision.PointTracker。或者您可以使用extractFeatures之后matchFeatures。
2、使用估计基本矩阵estimateFundamentalMatrix。
3、使用该relativeCameraPose功能计算摄像机的运动。
4、在两个图像之间匹配一组密集的点。使用重新检测点detectMinEigenFeatures以降低’MinQuality’获得更多的积分。然后使用跟踪密集点进入第二张图像vision.PointTracker。
5、使用确定运动点的3-D位置triangulate。
6、检测已知大小的物体。在此场景中有一个地球仪,其半径已知为10厘米。用于pcfitsphere在点云中查找地球。
7、恢复实际比例,进行度量标准重建。
##1.读入一幅图像
imageDir = fullfile(toolboxdir('vision'), 'visiondata','upToScaleReconstructionImages');
images = imageDatastore(imageDir);
I1 = readimage(images, 1);
I2 = readimage(images, 2);
figure
imshowpair(I1, I2, 'montage');
title('Original Images');
```
##2.传入相机参数
- 本示例使用由cameraCalibrator应用计算的相机参数。这些参数存储在cameraParams对象中,并且包括相机固有特性和镜头畸变系数。

````matlab
% 加载预先计算的相机参数
load upToScaleReconstructionCameraParameters.mat
```
##3.消除镜头变形
- 镜头变形会影响最终重建的准确性。您可以使用该undistortImage功能消除每个图像的失真。此过程使由于透镜的径向变形而弯曲的线变直。
```
% Remove Lens Distortion
I1 = undistortImage(I1, cameraParams);
I2 = undistortImage(I2, cameraParams);
figure
imshowpair(I1, I2, 'montage');
title('Undistorted Images');
```

##4.查找图像之间的点的对应
- 检测要跟踪的良好功能。减少`MinQuality`以检测更少的点,这些点将在整个图像中更均匀地分布。如果摄像机的运动不是很大,则使用KLT算法进行跟踪是建立点对应关系的好方法。
```bash
%% Find Point Correspondences Between The Images
% Detect good features to track. You can reduce |'MinQuality'| to detect
% fewer points, which are more uniformly distributed throughout the image.
% Tracking with the KLT algorithm is a good way to establish point
% correspondences when there is less camera motion.
% 检测特征点
imagePoints1 = detectMinEigenFeatures(rgb2gray(I1), 'MinQuality', 0.1);
% 可视化检测到的点
figure
imshow(I1, 'InitialMagnification', 50);
title('150 Strongest Corners from the First Image');
hold on
plot(selectStrongest(imagePoints1, 150));
% 创建点跟踪器
%MaxBidirectionalError前后误差阈值,指定为标量。如果将值设置为小于inf,则跟踪器将跟踪从前一帧到当前帧的每个点。然后,它将相同的点追溯到前一帧。对象计算双向误差。该值是从点的原始位置到向后跟踪后的最终位置的像素距离。当误差大于为此属性设置的值时,相应的点被视为无效。推荐值介于0和 3像素之间。
%每个金字塔等级是通过将前一个等级的宽度和高度降低两倍来形成的。点跟踪器开始跟踪最低分辨率级别的每个点,并继续跟踪直到收敛。对象会将该级别的结果传播到下一个级别,作为对点位置的初始猜测。通过这种方式,跟踪将在每个级别上进行细化,直至原始图像。使用金字塔等级可以使点跟踪器处理较大的像素运动,该运动可能包括大于邻域大小的距离。
tracker = vision.PointTracker('MaxBidirectionalError', 1, 'NumPyramidLevels', 5);
% 初始化点跟踪器
imagePoints1 = imagePoints1.Location;
initialize(tracker, imagePoints1, I1);
% 跟踪点
[imagePoints2, validIdx] = step(tracker, I2);
matchedPoints1 = imagePoints1(validIdx, :);
matchedPoints2 = imagePoints2(validIdx, :);
% Visualize correspondences
figure
showMatchedFeatures(I1, I2, matchedPoints1, matchedPoints2);
title('Tracked Features');
```


##5.估计基本矩阵
- 使用该estimateEssentialMatrix函数计算基本矩阵并找到满足对极约束的内点
```matlab
%% 估计基本矩阵
% Use the |estimateFundamentalMatrix| function to compute the fundamental
% matrix and find the inlier points that meet the epipolar constraint.
% 估计基本矩阵
[fMatrix, epipolarInliers] = estimateFundamentalMatrix(...
matchedPoints1, matchedPoints2, 'Method', 'MSAC', 'NumTrials', 10000);
% 找到满足对极约束的内点
inlierPoints1 = matchedPoints1(epipolarInliers, :);
inlierPoints2 = matchedPoints2(epipolarInliers, :);
% 显示内部匹配
figure
showMatchedFeatures(I1, I2, inlierPoints1, inlierPoints2);
title('Epipolar Inliers');
```

##6.计算计算机姿势
计算第二个摄像头相对于第一个摄像头的位置与方向,请注意,t是一个单位向量,因为平移只能按比例计算。
```bash
%% 计算相机姿势
% Compute the rotation and translation between the camera poses
% corresponding to the two images. Note that |t| is a unit vector,
% because translation can only be computed up to scale.
[orient,loc] = relativeCameraPose(E,cameraParams,inlierPoints1,inlierPoints2);
```
##7.重建匹配点的3D位置
使用较低的像素重新检测第一张图像中的`MinQuality`点以获得更多的点。将新点跟踪到第二个图像中。使用该`triangulate`函数估计与匹配点相对应的3-D位置,该函数实现了直接线性变换(DLT)算法[1]。将原点放在与第一张图像相对应的相机的光学中心。
```bash
%检测密集特征点。使用ROI排除靠近
%图像边缘的点。
roi = [30,30,size(I1,2)-30,size(I1,1)-30];
imagePoints1 = detectMinEigenFeatures(rgb2gray(I1),'ROI',roi,...
'MinQuality',0.001);
%创建点跟踪器
tracker = vision.PointTracker('MaxBidirectionalError',1,'NumPyramidLevels',5);
%初始化点跟踪器
imagePoints1 = imagePoints1.Location;
initialize(tracker,imagePoints1,I1);
%追踪分数
[imagePoints2,validIdx] = step(tracker,I2);
matchedPoints1 = imagePoints1(validIdx,:);
matchedPoints2 = imagePoints2(validIdx,:);
%计算相机每个位置的相机矩阵
%第一台相机位于沿Z轴的原点。因此,其
%旋转矩阵为恒等,其平移向量为0。
camMatrix1 = cameraMatrix(cameraParams,eye(3),[0 0 0]);
%计算第二台相机的外部性
[R,t] = cameraPoseToExtrinsics(orient,loc);
camMatrix2 = cameraMatrix(cameraParams,R,t);
%计算3-D点
points3D = triangulate(matchedPoints1,matchedPoints2,camMatrix1,camMatrix2);
%获取每个重构点的颜色
numPixels = size(I1,1)* size(I1,2);
allColors = reshape(I1,[numPixels,3]);
colorIdx = sub2ind([size(I1,1),size(I1,2)],round(matchedPoints1(:,2)),...
round(matchedPoints1(:, 1)));
color = allColors(colorIdx,:);
%创建点云
ptCloud = pointCloud(points3D,'Color',color);
```
##8.显示3D点云
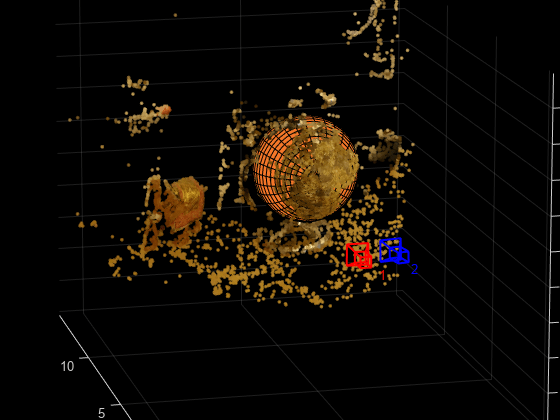
使用该plotCamera功能可以可视化相机的位置和方向,并可以使用该pcshow功能来可视化点云。
```
% 可视化摄像头的位置和方向
cameraSize = 0.3;
figure
plotCamera('Size', cameraSize, 'Color', 'r', 'Label', '1', 'Opacity', 0);
hold on
grid on
plotCamera('Location', loc, 'Orientation', orient, 'Size', cameraSize, ...
'Color', 'b', 'Label', '2', 'Opacity', 0);
% 可视化点云
pcshow(ptCloud, 'VerticalAxis', 'y', 'VerticalAxisDir', 'down', ...
'MarkerSize', 45);
% 旋转并缩放绘图
camorbit(0, -30);
camzoom(1.5);
% Label the axes
xlabel('x-axis');
ylabel('y-axis');
zlabel('z-axis')
title('Up to Scale Reconstruction of the Scene');
```

##9.利用点云将球体拟合以查找地球
使用pcfitsphere函数将球体拟合到3-D点,从而在点云中找到地球
```
% Detect the globe
globe = pcfitsphere(ptCloud, 0.1);
% Display the surface of the globe
plot(globe);
title('Estimated Location and Size of the Globe');
hold off
```

##10.场景三维重建
```
% 确定比例因子
scaleFactor = 10 / globe.Radius;
% 缩放点云
ptCloud = pointCloud(points3D * scaleFactor, 'Color', color);
loc = loc * scaleFactor;
% 以厘米显示点云
cameraSize = 2;
figure
plotCamera('Size', cameraSize, 'Color', 'r', 'Label', '1', 'Opacity', 0);
hold on
grid on
plotCamera('Location', loc, 'Orientation', orient, 'Size', cameraSize, ...
'Color', 'b', 'Label', '2', 'Opacity', 0);
% 可视化点云
pcshow(ptCloud, 'VerticalAxis', 'y', 'VerticalAxisDir', 'down', ...
'MarkerSize', 45);
camorbit(0, -30);
camzoom(1.5);
% Label the axes
xlabel('x-axis (cm)');
ylabel('y-axis (cm)');
zlabel('z-axis (cm)')
title('Metric Reconstruction of the Scene');
```

**更多请参考**:
[外链图片转存失败,源站可能有防盗链机制,建议将图片保存下来直接上传(img-5Cvd7rVq-1575246541715)(https://note.youdao.com/yws/api/personal/file/WEB3e69e86739a238787b879f4789e6bff5?method=download&shareKey=bbdb8f100dfafe198e705daf0bdbfd1c)]