GoogLeNet用matlab程序绘制loss曲线
对训练的caffe.bat文件进行编辑,在最后加上>trainlog.txt 2>&1,即可实现将cmd打印出来的信息保存到trainlog.txt文件中。
SET GLOG_logtostderr=1
caffe.exe路径 train --solver solver.prototxt路径 >trainlog.txt 2>&1
pause
这样在训练完成之后,日志信息全都保存到了trainlog.txt文件中。

然后进行绘图。
代码以及部分注释如下所示。
%%loss示例
clc;clear
logName='C:\Users\dell\Desktop\trainlog.txt';%%trainlog.txt的路径
dir_log='C:\Users\dell\Desktop\loss\';%%保存以下五个txt文件的路径
fid = fopen(logName, 'r');    %%read 读取日志文件
test_loss = fopen([dir_log 'test_loss.txt'], 'w'); %%write 往txt文件中写内容
train_loss = fopen([dir_log 'train_loss.txt'], 'w');
train_lr = fopen([dir_log 'train_lr.txt'],'w');
test_acc = fopen([dir_log 'test_acc.txt'], 'w');
train_acc = fopen([dir_log 'train_acc.txt'], 'w');
tline = fgetl(fid);
while ischar(tline)   %%按行读取日志文件中的内容
    k = strfind(tline, 'Iteration');   %%查找Iteration,并返回在这一行的第几列
    % it's a valid log
    if ~isempty(k)
        iter_start = k + 10;
        iter_end = strfind(tline(k:end),','); %%找到逗号
        iter = tline(iter_start:iter_end + k-2);
        %store test_loss
        lr_k = strfind(tline, 'lr');
        if ~isempty(lr_k)
            lr_tart = lr_k + 5;
            lr = tline(lr_tart : end);
            fprintf(train_lr, '%s\t%s\n', iter,lr);
        end
        %store train_loss
        train_k = strfind(tline, 'loss');
        if ~isempty(train_k)
            train_tart = train_k + 7;
            loss_train = tline(train_tart : end);
            fprintf(train_loss, '%s\t%s\n', iter,loss_train);
        end
        %store test_loss
        test_k = strfind(tline, 'Testing');
        if ~isempty(test_k) %
            tline = fgetl(fid);
            flag = 1;
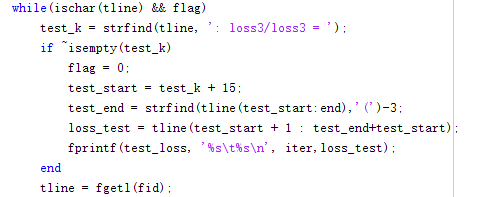
            while(ischar(tline) && flag)
                test_k = strfind(tline, ': loss3/loss3 = ');
                if ~isempty(test_k)
                    flag = 0;
                    test_start = test_k + 15;
                    test_end = strfind(tline(test_start:end),'(')-3;
                    loss_test = tline(test_start + 1 : test_end+test_start);
                    fprintf(test_loss, '%s\t%s\n', iter,loss_test);
                end
                tline = fgetl(fid);
            end
        end
    end
    tline = fgetl(fid);
end
fclose(fid);
fclose(test_loss);
fclose(train_loss);
%fclose(train_lr);
%plot

train_loss=importdata([dir_log 'train_loss.txt']);
if(~isempty(train_loss))
    figure(1)
    plot(train_loss(:,1),train_loss(:,2));
    title('train-loss vs. Iterations')
end


test_loss=importdata([dir_log 'test_loss.txt']);
if(~isempty(test_loss))
    figure(2)
    plot(test_loss(:,1),test_loss(:,2));
    title('test-loss vs. Iterations')
end

fid = fopen(logName, 'r');
tline = fgetl(fid);
while ischar(tline)
    k = strfind(tline, 'Iteration');
    % it's a valid log
    if ~isempty(k)
        iter_start = k+10;
        iter_end = strfind(tline(k:end),',');
        iter = tline(iter_start:iter_end+k-2);
        %store test_loss
        lr_k = strfind(tline, 'lr');
        if ~isempty(lr_k)
            lr_tart = lr_k + 5;
            lr = tline(lr_tart : end);
            fprintf(train_lr, '%s\t%s\n', iter,lr);
        end
        %store train_loss
        train_k = strfind(tline, 'accuracy');
        if ~isempty(train_k)
            train_tart = train_k + 7;
            loss_train = tline(train_tart : end);
            fprintf(train_loss, '%s\t%s\n', iter,loss_train);
        end
        %store test_loss
        test_k = strfind(tline, 'Testing');
        if ~isempty(test_k) %
            tline = fgetl(fid);
            flag = 1;
            while(ischar(tline) && flag)
                test_k = strfind(tline, ': loss3/top-1 =');
                if ~isempty(test_k)
                    flag = 0;
                    test_start = test_k + 14;
                    test_end = size(tline);
                    acc_test = tline(test_start+1 : test_end(2));
                    fprintf(test_acc, '%s\t%s\n',iter,acc_test);
                end
                tline = fgetl(fid);
            end
        end
    end
    tline = fgetl(fid);
end
fclose(fid);
fclose(test_acc);
fclose(train_acc);
fclose(train_lr);
%plot

train_acc=importdata([dir_log 'train_acc.txt']);
if(~isempty(train_acc))
    figure(3)
    plot(train_acc(:,1),train_acc(:,2));
    title('train-loss vs. Iterations')
end


test_acc=importdata([dir_log 'test_acc.txt']);
if(~isempty(test_acc))
    figure(4)
    plot(test_acc(:,1),test_acc(:,2));
    title('test-acc vs. Iterations')
end
该部分代码很通用,但是需要改动几个地方。


上图中的 test_start = test_k + n; 代码中的n需要看情况进行修改,多看看就明白了。
作者:GL3_24
来源:CSDN
著作权归作者所有。转载请联系作者获得授权。