echarts 雷达图一些自我总结
最近在使用echarts雷达图的时候有一些新得想分享一下,话不多说直接看代码
 var option=
         {
            //title: { text:null }, // 隐藏图表标题
                legend: {
                    show: true,
                   top:0,
                   right:0,
                   orient: 'vertical',
                    data: ['同行业平均评分', '企业当前评分'],
                    textStyle:{
                        fontSize: 12,
                        color:'#fff'
                    }
                },
                color:['#F8E71C','rgb(146,207,72)'],
            tooltip : {
                trigger: 'item',
                backgroundColor:'rgba(14,33,62,0.8)',
                formatter: function (params) {
                    return `

                    ${params.seriesName}


                    安全驾驶:
                    ${parseFloat(params.value[0]/2.5).toFixed(1)}分

                    车辆运行:
                    ${parseFloat(params.value[1]/3.3).toFixed(1)}分


                    GPS在线:
                    ${parseFloat(params.value[3]/5).toFixed(1)}分

                    工作负荷:
                    ${parseFloat(params.value[2]/10).toFixed(1)}分

                    `
              },
                position: function (point, params, dom, rect, size) {
                    // 鼠标坐标和提示框位置的参考坐标系是:以外层div的左上角那一点为原点,x轴向右,y轴向下
                    // 提示框位置
                    var x = 0; // x坐标位置
                    var y = 0; // y坐标位置

                    // 当前鼠标位置
                    var pointX = point[0];
                    var pointY = point[1];

                    // 外层div大小
                    // var viewWidth = size.viewSize[0];
                    // var viewHeight = size.viewSize[1];

                    // 提示框大小
                    var boxWidth = size.contentSize[0];
                    var boxHeight = size.contentSize[1];

                    // boxWidth > pointX 说明鼠标左边放不下提示框
                    if (boxWidth > pointX) {
                      x = 5;
                    } else { // 左边放的下
                      x = pointX - boxWidth;
                    }

                    // boxHeight > pointY 说明鼠标上边放不下提示框
                    if (boxHeight > pointY) {
                      y = 5;
                    } else { // 上边放得下
                      y = pointY - boxHeight;
                    }

                    return [x, y];
                }
            },
            calculable : true,
            polar : [
                {
                    nameGap : 5, // 图中工艺等字距离图的距离
                    center:['50%','50%'], // 图的位置
                    name:{
                       show: true, // 是否显示工艺等文字
                       formatter: null, // 工艺等文字的显示形式
                       textStyle: {
                         color:'#a3a5b6' // 工艺等文字颜色
                       }
                     },
                    indicator : [
                        {text : '安全驾驶', max  : 100},
                        {text : '车辆运行', max  : 100},
                        {text : '工作负荷', max  : 100},
                        //{text : '工作负荷', max  : 100},
                        {text : 'GPS在线', max  : 100}
                    ],

                    axisLine: {            // 坐标轴线
                        show: false,        // 默认显示,属性show控制显示与否
                        lineStyle: {
                            color: 'white'
                          }
                    },
                    axisLabel: {           // 坐标轴文本标签,详见axis.axisLabel
                        show: false,
                        textStyle: {
                            color: '#FFFFFF' // 坐标轴刻度文字的样式
                        }
                    },
                    splitArea : {
                        show : true,
                        areaStyle : {
                            color: ["rgba(0,0,0,0)"]  // 图表背景网格的颜色
                        }
                    },
                    splitLine : {
                        show : true,
                        lineStyle : {
                            width : 1,
                            color : '#015ECF' // 图表背景网格线的颜色
                        }
                    }
                }
            ],
            series : [
                {
                    name: "同行业对比评分",
                    type: 'radar',
                    symbol:'circle', // 去掉图表中各个图区域的边框线拐点
                    itemStyle: {
                        normal: {
                            // color : "#F8E71C", // 图表中各个图区域的边框线拐点颜色
                            // lineStyle: {
                            //     color:"#F8E71C" // 图表中各个图区域的边框线颜色
                            // },
                            areaStyle: {
                                type: 'default',
                                color : "rgba(0,0,0,0)"
                            }
                        }
                    },
                    data : [
                        {
                            value : [93,72,61,32],
                            itemStyle: {
                                normal: {
                                    areaStyle: {
                                        type: 'default',
                                        opacity: 0.8, // 图表中各个图区域的透明度
                                        color: "#1686c2" // 图表中各个图区域的颜色
                                    }
                                }
                            },
                            name : '同行业平均评分'
                        },
                        {
                                 value:[85,70,35,20],
                                 itemStyle: {
                                     normal: {
                                         areaStyle: {
                                             type: 'default',
                                             opacity: 0.8, // 图表中各个图区域的透明度
                                             color: "#1686c2" // 图表中各个图区域的颜色
                                         }
                                     }
                                 },
                                 name : '企业当前评分'
                             }
                    ]
                }
            ]
        }
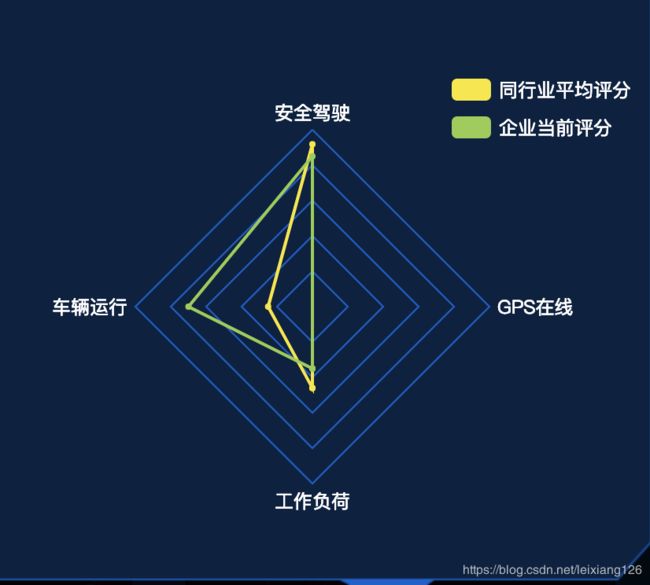
效果图:
目前这个雷达图还有一个效果没有实现就是点击坐标上的点显示2条线在这条线的的数值,看了好多关于这个问题,发现官方3.0版本之后就出现这个问题
tooltip : {

trigger: 'axis'

}
也就是上面的代码失效,目前有人解决这个问题
在做这个雷达图的时候还遇到一个问题,就是假如定在满分是100分,假如其中某个项的值满分不是100分,可以先把这个值按100分的比例扩大,在鼠标放上去的时候的悬浮框再把这个扩大值缩小,保证所有指标的效果更明显
tooltip : {
                trigger: 'item',
                backgroundColor:'rgba(14,33,62,0.8)',
                formatter: function (params) {
                    return `

                    ${params.seriesName}


                    安全驾驶:
                    ${parseFloat(params.value[0]/2.5).toFixed(1)}分

                    车辆运行:
                    ${parseFloat(params.value[1]/3.3).toFixed(1)}分


                    GPS在线:
                    ${parseFloat(params.value[3]/5).toFixed(1)}分

                    工作负荷:
                    ${parseFloat(params.value[2]/10).toFixed(1)}分

                    `
              },
