Spring Cloud 入门——2.2 Hystrix 熔断器添加数据监控
代码信息
本篇文章涉及代码版本
| 组件 | 版本 |
|---|---|
| Spring Boot | 2.0.8.RELEASE |
| Spring Cloud | Finchley.SR1 |
本篇文章涉及应用
| 应用 | 说明 |
|---|---|
| base-eureka | 服务发现 |
| base-hystrix-dashboard | 添加了数据监控依赖的 熔断器 |
为Hystrix添加数据监控功能
为了更方便的监视Hystrix的运行情况,Hystrix提供了一个组件来监控请求数据,并且提供了数据的可视化组件。hystrix-dashboard
构建maven依赖
想要开启此功能需要引入下面的内容
    <dependency>
        <groupId>org.springframework.cloudgroupId>
        <artifactId>spring-cloud-starter-netflix-hystrixartifactId>
    dependency>
    <dependency>
        <groupId>org.springframework.cloudgroupId>
        <artifactId>spring-cloud-starter-netflix-hystrix-dashboardartifactId>
    dependency>
注意下面依赖在父项目中已经被引入,所以可以不需要引入
    <dependency>
        <groupId>org.springframework.bootgroupId>
        <artifactId>spring-boot-starter-actuatorartifactId>
    dependency>
参数配置application.yml
spring:
  application:
    name: base-hystrix-dashboard
server:
  port: 8405

eureka:
  client:
    service-url:
      defaultZone: http://localhost:8000/eureka/
logging:
  file: ${spring.application.name}.log
  # 配置监控端点
management:
  endpoints:
    web:
      exposure:
        # 默认配置中只有"health","info"
        include: ["health","info","hystrix.stream"]
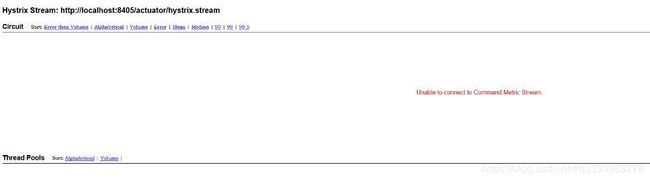
上面management.endpoints.web.exposure.include不添加hystrix.stream查看数据的时候会出现下面情况:Unable to connect to Command Metric Stream.
代码编写
启动类
@EnableEurekaClient
@SpringBootApplication
@EnableCircuitBreaker
@EnableHystrixDashboard
public class HystrixApplication {

    public static void main(String[] args) {
        SpringApplication.run(HystrixApplication.class, args);
    }
}
启动类中除了之前的注解需要添加@EnableHystrixDashboard
模拟请求的代码
@Log
@Service
public class ClientService {

    @Autowired
    LoadBalancerClient loadBalancerClient;
    @Autowired
    RestTemplate restTemplate;

    /**
     * 配置降级方法
     * @return
     */
    @HystrixCommand(fallbackMethod = "getServiceBack")
    public String getService() {
        ServiceInstance serviceInstance = loadBalancerClient.choose("base-producer");
        String url = "http://" + serviceInstance.getHost() + ":" + serviceInstance.getPort() + "/getService";
        log.info(url);
        return restTemplate.postForObject(url,null, String.class);
    }


    public String getServiceBack() {
        return "use fallbackMethod";
    }

}
上面内容完成后启动服务中心以及服务提供项目和本项目
配置监控地址
进入地址http://localhost:8405/hystrix可以看到下面内容
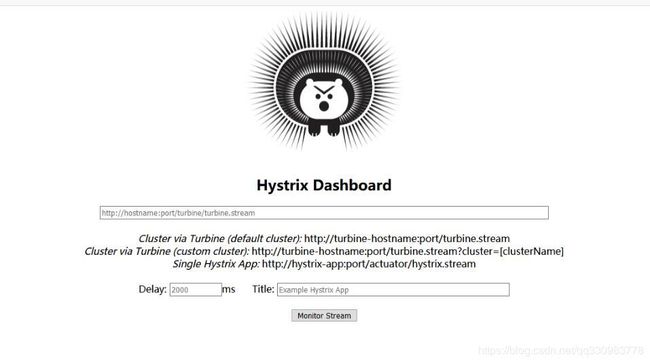
此时有几个需要注意的;
- 我们现在因为没有引入turbine所以只能进行单一应用进行监控,无法对集群进行监控。
- 另外需要注意的在springboot1.X的时候,这里我们监控地址是http://:/hystrix.stream,spring boot2.0之后使用 http://:/actuator/hystrix.stream的地址
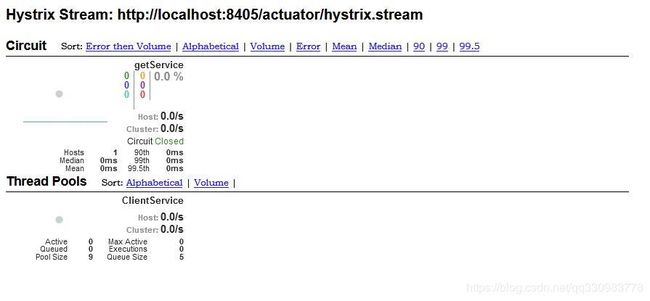
此时填写需要监控的地址如:http://localhost:8405/actuator/hystrix.stream会进入下面内容
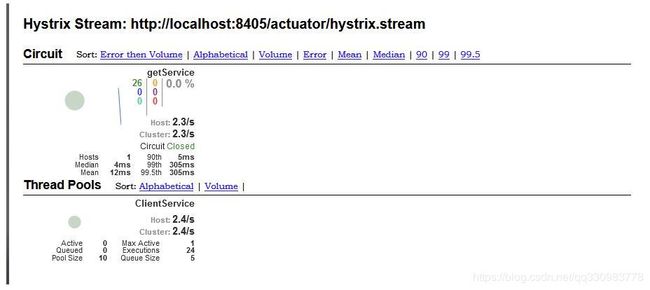
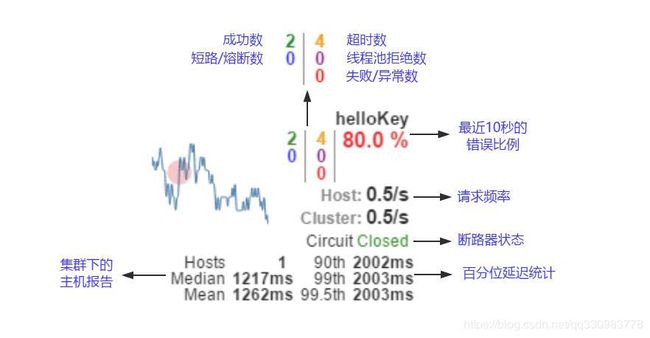
然后我们尝试不停的请求http://localhost:8405/hystrixGetService地址查看数据变化。
关于这些内容的意思我就直接引用大神,程序猿DD的图了
本篇文章涉及的源码下载地址:https://gitee.com/daifylearn/cloud-learn
ps.上述的所有项目都是可以成功运行的。但是在后期为了实现每个应用端口尽量不冲突会有些许调整,而后续某次作死调整结构和名称可能会导致部分项目无法运行o(╯□╰)o,如果发现请留言我进行修改。