0.基本操作
可以在命令行直接做简单的基础运算
若做复杂运算,需要使用脚本

如果进一步,需要自定规则的话,使用新的函数,就需要构建新的函数
clc:清理命令行
clear(clear all):清理所有的命令,包括生成的数值
1.基础运算
四则运算
+, * , / 对应 加减乘除
= 为赋值符
mod(a,b)表示a/b的余数
关于log
底数e , 2 , 10
log(x)默认为ln(x)
只存在log10(x),log2(x)
其他的表示,如:log8(7) 表示为 log7 / log8
关于矩阵
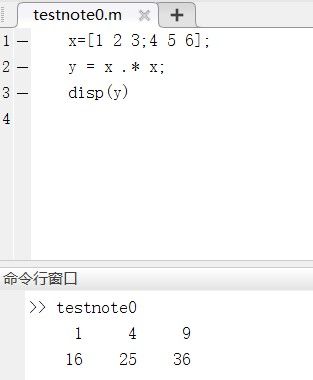
如:x=[1 2 3;4 5 6]矩阵每一行用;隔开
| 1 | 2 | 3 |
|---|---|---|
| 4 | 5 | 6 |
矩阵+ - * / 相同,.代表点对点的相乘而非矩阵乘法,同理,.+* , ./ , .-代表每个元素对应相加,除,减
输出
在命令窗口想要看见某个变量可以用disp(x)
多个变量可以用disp([x,y,z]),但是这样输出没有隔开,所以可以disp([x,' ',y,' ',z])这样输出
2.关于脚本
;的作用是可以屏蔽那一行的运行结果
x = input('please enter x:');让变量自定义
%加注释
如果要显示某个数,可以直接在代码中某一行写出变量名,也可以写fprintf('…… = %f\n',x);x为变量,''中间为打印的内容,%f为输出x的类型,可以是其他的;\n是换行符
input输入;fprintf输出;和c语言类似
3.关于结构
选择结构
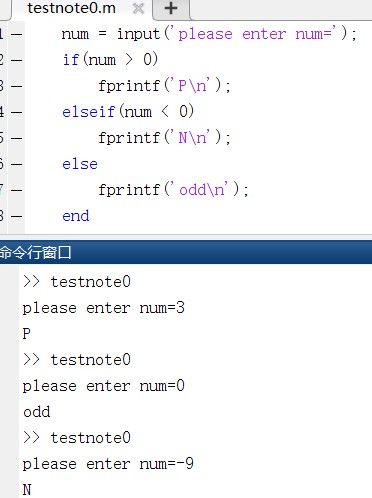
%函数表示输入的正负,正输出P,负输出N,0输出odd
num = input('please enter num=');
if(num > 0)
    fprintf('P\n');
elseif(num < 0)zhengf
    fprintf('N\n');
else
    fprintf('odd\n');
end
%函数输出绝对值
num = input('please enter num=');
if num>0
    disp(num);
else
    disp(num-2*num);
end

如果有多个条件则用&&(或者)和||(并且)把条件连起来
循环结构
while
%循环+1
t =0;
while t < 9
    disp(t);
    t = t + 1;
end

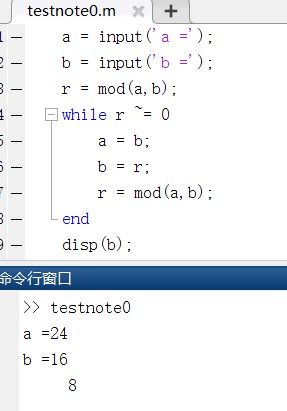
%辗转相除法求最大公约数
a = input('a =');
b = input('b =');
r = mod(a,b);
while r ~= 0
    a = b;
    b = r;
    r = mod(a,b);
end
disp(b);
For
s = 0;
for i = 1: 2 :100
    s = s + i;
end
disp(s)
i = 1 : 2 : 100
表示从1开始两个两个的数到100,如:1 3 5 7 9……
i = 1 : 100表示从1开始数到100,没有步长默认为1
i = -8 : -1 : -20表示从-8数到-20,倒着数必须是步长为负
v = [1 2 3 4 5 6 7 8 9];
s = 0;
for i =v
    s = s+i;
end
disp(s);
for还可以挨个取出矩阵中的值
(二维两个for,三维三个for)
4.关于函数
function中
function AAA( )
	s = 0;
	for i = 1:2:100
		s = s + i;
	end
	disp(s)
end
这样就算做了个函数,累加
function AAA(a , b)
    s = 0;
    for i = a : 2 : b
        s = s + i;
    	end
    disp(s);
end
这样自定义变量的函数,累加
有个问题,这样子的函数没有返回值,也就不能存储,不能赋值
于是
function result = functiontest1(a , b)
    s = 0;
    for i = a:2 :b
        s = s + i;
    end
    result = s;
end
做一个返回值,这样就可以赋值了
计算约数个数
function result = functiontest1(n)
    counter = 0;
    for i = 1 : n
       if mod(n , i) == 0
           counter = counter + 1;
       end
    end
    result = counter;
end
判断是否为质数并返回值
function result = BBB(n)
    counter = AAA(n);
    if counter == 2
        result = 1;
    else
        result = 0;
    end
end
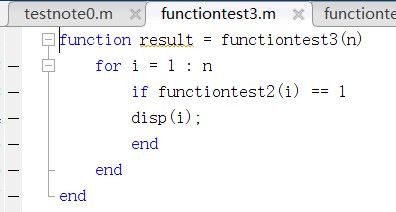
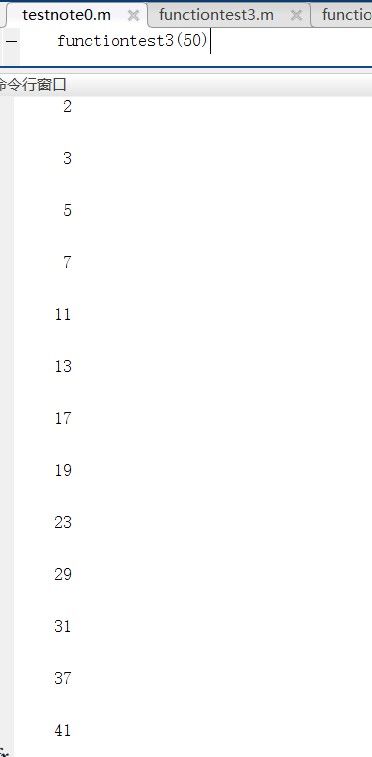
展示1~n中所有质数
function result = functiontest3(n)
    for i = 1 : n
        if functiontest2(i) == 1
        disp(i);
        end
    end
end
5.画图
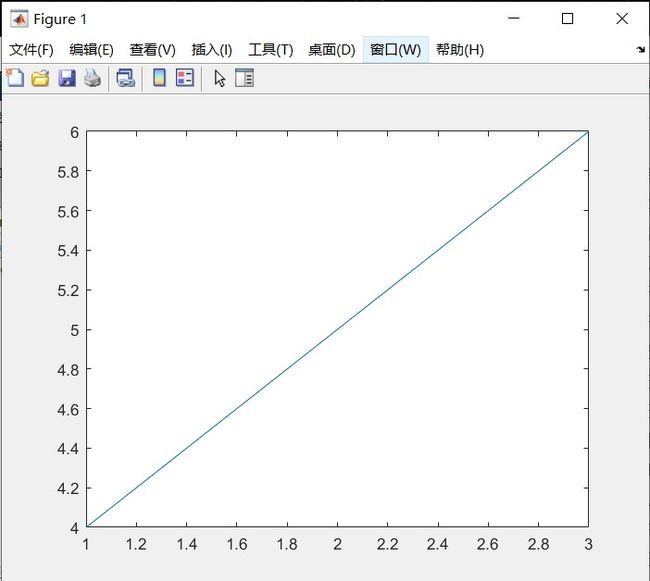
函数图plot函数
plot表示连接所有点
x = [1 2 3];

y = [4 5 6];

plot(x , y);
画直线(1,4)(2,5)(3,6)
同样,画曲线y=x^2^
x = -50 : 0.001 : 50;

y = x.^2;	或者	y = x .* x;

plot(x , y)
或者,同一张图画两条
x = -50 : 0.001 : 50;
y = x .^2;
y1 = x .^2 + 5;
plot(x , y , 'red',x , y1 , 'black')
plot(x , y , 'red-o',x , y1 , 'black')
axis equal
画两条
plot(x , y , 'red',x , y1 , 'black')
在红色的那条每个点上标上圈
plot(x , y , 'red-o',x , y1 , 'black')
使横纵坐标处于单位长度
axis equal

补充
x1 = -5 : 0.1 : 5;
y1 = x1 .^ 2;
plot(x1 , y1);

hold on;				#保持y1的图像在图片上,否则y2会覆盖y1

x2 = -5 : 0.1 : 5;
y2 = 5*x2 .^ 2+5;
plot(x2 , y2);

grid on;				#在图像上加上格子
title('x^2 vs 5*x^2+5');	#在图像顶上加上标题
xlabel('x-axis');		#在图像x轴上加上标题
ylabel('y-axis');		#在图像y轴上加上标题

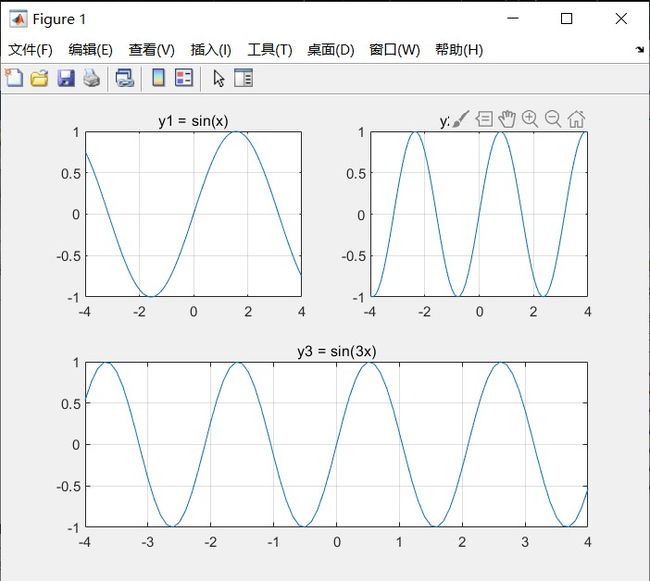
补充2
x = -4 : 0.1 : 4;
y1 = sin(x);
y2 = sin(2*x);
y3 = sin(3*x);

subplot(2 , 2 , 1)		#把背景分为2行2列,在第一个图上
plot(x, y1)
title('y1 = sin(x)');
grid on;

subplot(2 , 2 , 2)		#把背景分为2行2列,在第二个图上
plot(x, y2)
title('y2 = sin(2x)');
grid on;

subplot(2 , 2 , [3 , 4])#把背景分为2行2列,在第3,4合并图上
plot(x, y3)
title('y3 = sin(3x)');
grid on;
直方图bar函数
x = 2000:2010;
y = 94 : 7 : 164;
bar(x,y)

3D图像plot3函数
螺旋上天图
theta = 0 : pi/50 : 6*pi;

x = cos(theta);

y = sin(theta);

z = 0 : 300;

plot3(x , y , z)

曲面surf函数
蓝白碗
x = -3 : 0.01 :3;

y = -3 : 0.01 :3;

[X , Y] = meshgrid(x , y);
#让x,y轴的点扩展为平面的点,理解为转置

Z = X .^ 2 + Y .^ 2;

surf(X , Y , Z);

shading flat;
#平面着色防止因为分太密而漆黑一片,每个平面一个色

6.动图
波浪
X = -pi : 0.1 : pi;
Y = sin(X);

h = plot(X , Y);		#把函数图用h表示

while 1					#循环
    X = X + 0.1;		#移动X
    Y = sin(X);
    set(h , 'XData' , X , 'YData' , Y);
    #修改h的值,更新h的X与Y的数据
    drawnow;
    #重新画一遍
end
弹簧
theta = -10 * pi : 0.1 : 10 * pi;
X = cos(theta);
Y = sin(theta);
Z = theta;

h = plot3(X , Y , Z);
axis([-2 , 2 , -2 , 2 , -40 , 40]);
#固定X,Y,Z轴坐标为(-2,2)(-2,2)(-40,40)

while 1
	#压缩弹簧
    for i = 1 : 100
        Z = 0.96 * Z;
        set(h, 'XData' ,X , 'YData' ,Y , 'ZData' ,Z);
        drawnow;
    end

	#伸展弹簧
    for i = 1 : 100
        Z = Z / 0.96;
        set(h, 'XData' ,X , 'YData' ,Y , 'ZData' ,Z);
        drawnow;
    end
end

时钟
#画圆
t = 0 : pi/50 : 2 * pi;
X = cos(t);
Y = sin(t);
plot(X , Y);

hold on;
axis equal;

#画线段
LineX = [0 , 0];
LineY = [0 , 1];
h = plot(LineX , LineY);
theta = pi / 2;

while 1
    theta = theta - 0.01;
    LineX(2) = cos(theta);	#边上的点变化
    LineY(2) = sin(theta);	#边上的点变化
    set(h , 'XData' , LineX  , 'YData' , LineY);
    drawnow;
end
