TICK (telegraf + InfluxDB + Chronograf + Kapacitor)是一个开源的系统监控解决方案,由多个开软软件组成的系统套装,包括如下组件:
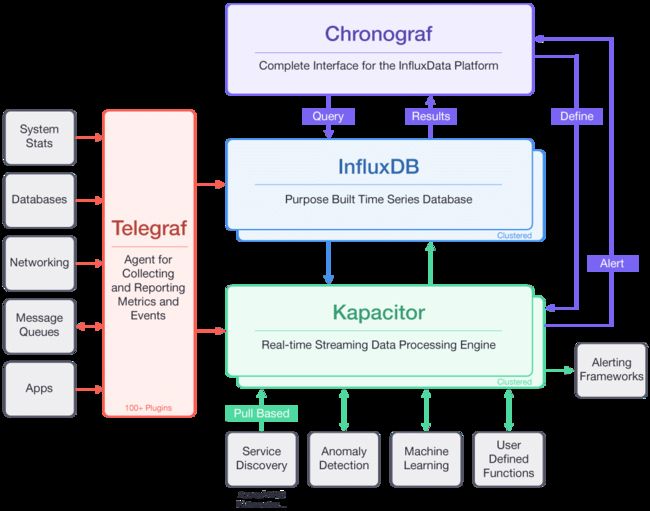
Telegraf 搜集各种数据源的时序数据
InfluxDB 存储时序数据
Chronograf 可视化时序数据
Kapacitor 对时序数据进行分析和报警
每个组件都可以单独使用,或者配合其他产品使用,本例只用TICK套装搭建系统监控解决方案。
添加 TICK 套装 Repository
执行以下命令添加repository
cat <安装 InfluxDB
sudo yum install influxdb
启动
sudo service influxdb start
停止
sudo service influxdb stop
查看状态
sudo service influxdb status
运行influxdb控制台
influx
创建 admin 用户
CREATE USER "bing" WITH PASSWORD 'qianyitian' WITH ALL PRIVILEGES
查看用户状态
show users
退出控制台
exit
启用安全控制
编辑文件 /etc/influxdb/influxdb.conf, 改动如下:
# Determines whether HTTP authentication is enabled.
auth-enabled = true
重启influxdb
sudo service influxdb restart
安装 Telegraf
安装
sudo yum install telegraf
配置输出目标为 influxdb, 编辑文件 /etc/telegraf/telegraf.conf, 找到 [outputs.influxdb] 关键字,进行相应修改
[[outputs.influxdb]]
     ## The full HTTP or UDP endpoint URL for your InfluxDB instance.
     ## Multiple urls can be specified as part of the same cluster,
     ## this means that only ONE of the urls will be written to each interval.
     # urls = ["udp://localhost:8089"] # UDP endpoint example
     urls = ["http://localhost:8086"] # required
     ## The target database for metrics (telegraf will create it if not exists).
     database = "telegraf" # required

     ...

     ## Write timeout (for the InfluxDB client), formatted as a string.
     ## If not provided, will default to 5s. 0s means no timeout (not recommended).
     timeout = "5s"
     username = "bing"
     password = "qianyitian"
启动
sudo service telegraf start
查看状态
sudo service telegraf status
停止
sudo service telegraf stop
Telegraf 会将采集的数据发送到influxdb, 并创建数据库 telegraf 来保存数据。登陆influxdb,验证数据是否采集成功
influx -username 'bing' -password 'qianyitian'
show databases
查看是否有 数据库 telegraf
使用数据库 telegraf
use telegraf
查看都搜集了哪些数据信息
show measurements
可以看到收集到了cpu, io, disk, mem等信息。
使用telegraf 可以采集60多种数据源信息。详情参见 https://docs.influxdata.com/telegraf/v1.5/plugins/inputs/
安装 Chronograf
Chronograf 是一个数据可视化软件,包含控制台,报表。同时可以集成KapacitorK 提供报警功能
安装
sudo yum install chronograf
启动
service chronograf starts
Chronograf 使用的默认http 服务端口号为 8888, 所以需要开启防火墙
firewall-cmd --zone=public --permanent --add-port=8888/tcp
firewall-cmd --reload
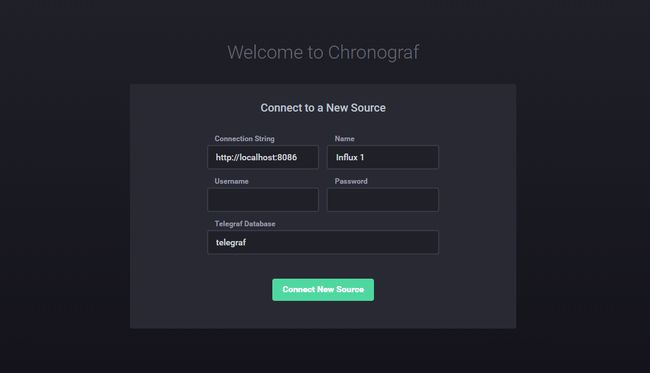
可以通过 http://server_ip:8888 访问 chronograf
在欢迎页面中填写Infuxdb的用户名密码, 点击 连接数据源 按钮
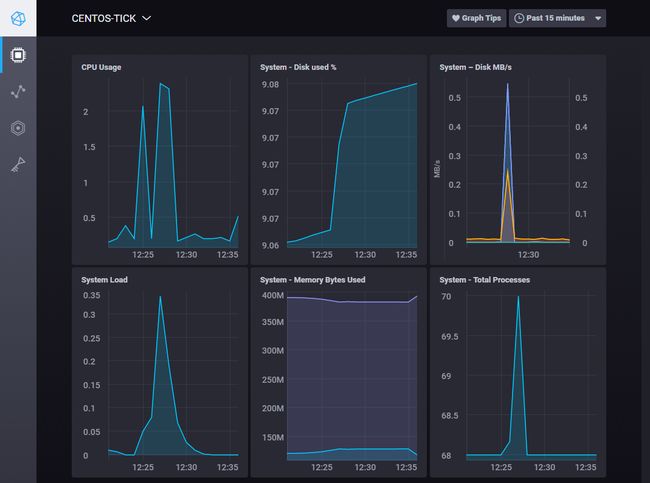
在服务器列表里面点击服务器的名字, 会出现如下图表
安装 Kapacitor
Kapacitor 是数据处理引擎,主要用来作为报警使用。
安装
sudo yum install kapacitor
编辑文件 /etc/kapacitor/kapacitor.conf , 定位到 [[influxdb]],作如下修改
# Multiple InfluxDB configurations can be defined.
# Exactly one must be marked as the default.
# Each one will be given a name and can be referenced in batch queries and InfluxDBOut nodes.
[[influxdb]]
  # Connect to an InfluxDB cluster
  # Kapacitor can subscribe, query and write to this cluster.
  # Using InfluxDB is not required and can be disabled.
  enabled = true
  default = true
  name = "localhost"
  urls = ["http://localhost:8086"]
  username = "bing"
  password = "qianyitian"
启动
service kapacitor start
查看kapacitor l任务列表
kapacitor list tasks
配置报警
在左侧导航栏, 找到 Alerting菜单, 点击后,会看到 Kapacitor 配置界面。配置好连接后,右侧出现报警项配置, 可以选择配置STMP,使用邮件报警。
选择 Create 菜单,创建新的报警规则。在Time Series中选择telegraf.autogen,再选择 system 项,选择 load1, load1 的数据会立即在下方的图表中显示出来。
在 Conditions中设置 load1 的阈值为 大于 0.1。
复制如下模版到 Alert Message 中,下方会有每个模版参数的解释。(使用鼠标在模版参数上浮动)。也可以配置更加人性化的信息模版。
{{ .ID }} is {{ .Level }} value: {{ index .Fields "value" }}
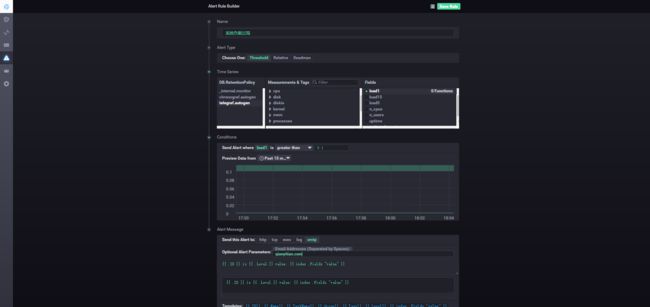
保存该报警配置项。
使用如下方法模拟系统高负载
dd if=/dev/zero of=/dev/null
查看是否收到报警邮件。
报警的方式可以选择很多种,推荐选择Slack。
TICK 套装可以用来采集,存储,分析,展示时序数据。更多的文章请参考官方文档。