前言
课程源于英特尔提供的学习资料。
人工智能学习目录
内容介绍
第一课也是第一周学习的内容,学习使用jupyter notebooks。了解python常用的数据出来和数据可视化库。
pandas
安装
python -m pip install pandas
介绍
- 表格数据计算库 Library for computation with tabular data
- 单一表中允许的混合类型数据 Mixed types of data allowed in a single table
- 可以将数据的列和行命名 Columns and rows of data can be named
- 高级数据聚合与统计函数 Advanced data aggregation and statistical functions
创建一个集合
import pandas as pd
import numpy as np
import matplotlib.pyplot as plt
step_data = [121, 7891, 9761, 3907, 4338, 5373]
step_counts = pd.Series(step_data,name = 'test')
print(step_counts)
0     121
1    7891
2    9761
3    3907
4    4338
5    5373
Name: test, dtype: int64
修改集合下标
修改集合下标为时间,可见index 0- 5 变成了时间.
应该属于键值对类型的集合。等同于修改了集合的建值
step_counts.index = pd.date_range('20180628', periods = 6)
print(step_counts)
2018-06-28     121
2018-06-29    7891
2018-06-30    9761
2018-07-01    3907
2018-07-02    4338
2018-07-03    5373
Freq: D, Name: test, dtype: int64
取值
print(step_counts['2018-06-28'])
print(step_counts[0])
121
121
似乎比我了解的键值对更加强大,还可以这样用。
print(step_counts['2018-06'])
2018-06-28     121
2018-06-29    7891
2018-06-30    9761
Freq: D, Name: test, dtype: int64
修改数据类型 astype
print(step_counts.dtypes)
step_counts = step_counts.astype(np.float)
print(step_counts.dtypes)
int64
float64
统一赋值为NaN
step_counts[1:3] = np.NaN
print(step_counts)
2018-06-28     121.0
2018-06-29       NaN
2018-06-30       NaN
2018-07-01    3907.0
2018-07-02    4338.0
2018-07-03    5373.0
Freq: D, Name: test, dtype: float64
把NaN值修改为0 fillna
step_counts = step_counts.fillna(0.)
print(step_counts)
2018-06-28     121.0
2018-06-29       0.0
2018-06-30       0.0
2018-07-01    3907.0
2018-07-02    4338.0
2018-07-03    5373.0
Freq: D, Name: test, dtype: float64
创建 DataFrame
二维的数组,也可以理解为表格
cycling_data = [10.7, 0, None, 2.4, 15.3, 10.9, 0, None]
joined_data = list(zip(step_data, cycling_data))
activity_df = pd.DataFrame(joined_data)
print(activity_df)
      0     1
0   121  10.7
1  7891   0.0
2  9761   NaN
3  3907   2.4
4  4338  15.3
5  5373  10.9
修改DataFrame 的行列值
可以理解为修改二维数组的横坐标与纵坐标。
activity_df = pd.DataFrame(joined_data, index=pd.date_range('20180628', periods=6), columns=['Walking','Cycling'])
print(activity_df)
            Walking  Cycling
2018-06-28      121     10.7
2018-06-29     7891      0.0
2018-06-30     9761      NaN
2018-07-01     3907      2.4
2018-07-02     4338     15.3
2018-07-03     5373     10.9
取值有所变化
print(activity_df.loc['2018-06-28'])
print(activity_df.iloc[0])
Walking    121.0
Cycling     10.7
Name: 2018-06-28 00:00:00, dtype: float64
Walking    121.0
Cycling     10.7
Name: 2018-06-28 00:00:00, dtype: float64
print(activity_df['Walking'])
print(activity_df.Walking)
print(activity_df.iloc[:,0])
print(activity_df.iloc[1,0])
2018-06-28     121
2018-06-29    7891
2018-06-30    9761
2018-07-01    3907
2018-07-02    4338
2018-07-03    5373
Freq: D, Name: Walking, dtype: int64
2018-06-28     121
2018-06-29    7891
2018-06-30    9761
2018-07-01    3907
2018-07-02    4338
2018-07-03    5373
Freq: D, Name: Walking, dtype: int64
2018-06-28     121
2018-06-29    7891
2018-06-30    9761
2018-07-01    3907
2018-07-02    4338
2018-07-03    5373
Freq: D, Name: Walking, dtype: int64
7891
读取csv文件
filepath = 'data/Iris_Data.csv'
data = pd.read_csv(filepath)
print(data.iloc[:5])
   sepal_length  sepal_width  petal_length  petal_width      species
0           5.1          3.5           1.4          0.2  Iris-setosa
1           4.9          3.0           1.4          0.2  Iris-setosa
2           4.7          3.2           1.3          0.2  Iris-setosa
3           4.6          3.1           1.5          0.2  Iris-setosa
4           5.0          3.6           1.4          0.2  Iris-setosa
data['sepal_area'] = data.sepal_length *data.sepal_width
print(data.iloc[:5, -4:])
   petal_length  petal_width      species  sepal_area
0           1.4          0.2  Iris-setosa       17.85
1           1.4          0.2  Iris-setosa       14.70
2           1.3          0.2  Iris-setosa       15.04
3           1.5          0.2  Iris-setosa       14.26
4           1.4          0.2  Iris-setosa       18.00
lambda表达式
还可以这样操作,使用lambda表达式
data['abbrev'] = data .species .apply(lambda x:x.replace('Iris-',''))
print(data.iloc[:5, -3:])
       species  sepal_area  abbrev
0  Iris-setosa       17.85  setosa
1  Iris-setosa       14.70  setosa
2  Iris-setosa       15.04  setosa
3  Iris-setosa       14.26  setosa
4  Iris-setosa       18.00  setosa
concat 合并表,矩阵合并
# print(data.iloc[:2])
# print(data.iloc[-2:])
small_data = pd.concat([data.iloc[:2], data.iloc[-2:]])
print(small_data.iloc[:,:4])
     sepal_length  sepal_width  petal_length  petal_width
0             5.1          3.5           1.4          0.2
1             4.9          3.0           1.4          0.2
148           6.2          3.4           5.4          2.3
149           5.9          3.0           5.1          1.8
groupby 分组
group_sizes = (data .groupby('species') .size())
print(group_sizes)
species
Iris-setosa        50
Iris-versicolor    50
Iris-virginica     50
dtype: int64
平均数 mean
print(data.mean())
print(data.sepal_length.mean())
sepal_length     5.843333
sepal_width      3.054000
petal_length     3.758667
petal_width      1.198667
sepal_area      17.806533
dtype: float64
5.843333333333334
中间值 median
print(data.petal_length.median())
4.35
众数
出现频率最多的数值
print(small_data.petal_length.mode())
0    1.4
dtype: float64
标准差、方差、SEM、分位数
标准差 std
方差 var
SEM
分位数 quantile
print(data.petal_length.std(),       data.petal_length.var(),     data.petal_length.sem())

print(data.quantile(0))
1.7644204199522626 3.113179418344519 0.1440643240210085
sepal_length     4.3
sepal_width      2.0
petal_length     1.0
petal_width      0.1
sepal_area      10.0
Name: 0, dtype: float64
print(data.describe())
       sepal_length  sepal_width  petal_length  petal_width  sepal_area
count    150.000000   150.000000    150.000000   150.000000  150.000000
mean       5.843333     3.054000      3.758667     1.198667   17.806533
std        0.828066     0.433594      1.764420     0.763161    3.368693
min        4.300000     2.000000      1.000000     0.100000   10.000000
25%        5.100000     2.800000      1.600000     0.300000   15.645000
50%        5.800000     3.000000      4.350000     1.300000   17.660000
75%        6.400000     3.300000      5.100000     1.800000   20.325000
max        7.900000     4.400000      6.900000     2.500000   30.020000
样本sample
sample = (data .sample(n=8, replace=False, random_state=12))
print(sample.iloc[:,:4])
     sepal_length  sepal_width  petal_length  petal_width
40            5.0          3.5           1.3          0.3
146           6.3          2.5           5.0          1.9
38            4.4          3.0           1.3          0.2
99            5.7          2.8           4.1          1.3
143           6.8          3.2           5.9          2.3
116           6.5          3.0           5.5          1.8
148           6.2          3.4           5.4          2.3
39            5.1          3.4           1.5          0.2
Matplotlib
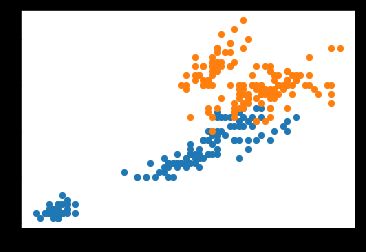
散点图
plt.plot(data.sepal_length, data.sepal_width, ls ='', marker='o', label='sepal')
[]
plt.plot(data.petal_length, data.petal_width,ls='',  marker='o', label='petal')
plt.plot(data.sepal_length, data.sepal_width, ls ='', marker='o', label='sepal')
[]
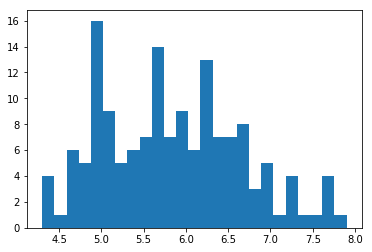
柱状图
plt.hist(data.sepal_length, bins=25)
(array([ 4.,  1.,  6.,  5., 16.,  9.,  5.,  6.,  7., 14.,  7.,  9.,  6.,
        13.,  7.,  7.,  8.,  3.,  5.,  1.,  4.,  1.,  1.,  4.,  1.]),
 array([4.3  , 4.444, 4.588, 4.732, 4.876, 5.02 , 5.164, 5.308, 5.452,
        5.596, 5.74 , 5.884, 6.028, 6.172, 6.316, 6.46 , 6.604, 6.748,
        6.892, 7.036, 7.18 , 7.324, 7.468, 7.612, 7.756, 7.9  ]),
 )
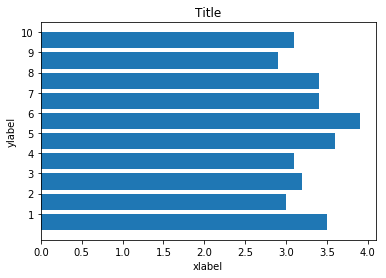
fig, ax = plt.subplots()
ax.barh(np.arange(10), data.sepal_width.iloc[:10])
# 设置坐标和表头
ax.set_yticks(np.arange(0.4,10.4,1.0))
ax.set_yticklabels(np.arange(1,11))
ax.set(xlabel='xlabel', ylabel='ylabel', title='Title')
[Text(0,0.5,'ylabel'), Text(0.5,0,'xlabel'), Text(0.5,1,'Title')]
data.groupby('species').mean().plot(color=['red','blue', 'black','green'], fontsize=10.0, figsize=(4,4))
seaborn
import seaborn as sns
sns.jointplot(x='sepal_length', y='sepal_width', data=data, size=4)
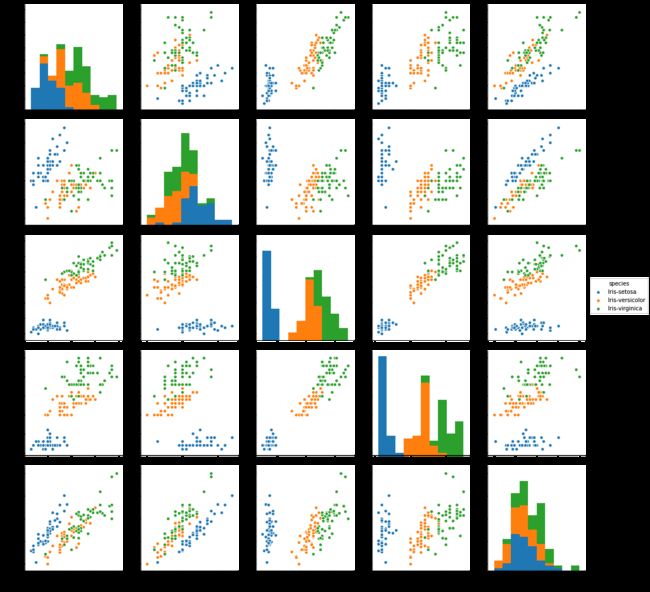
sns.pairplot(data, hue='species', size=3)
源码
https://download.csdn.net/download/yiershan1314/10497090


