linux 环境下:
1、安装go
 yum -y install go

  go version
2、安装 prometheus
wget https://github.com/prometheus/prometheus/releases/download/v2.2.1/prometheus-2.2.1.linux-amd64.tar.gz
tar -xvf prometheus-2.2.1.linux-amd64.tar.gz
cd prometheus-2.2.1.linux-amd64
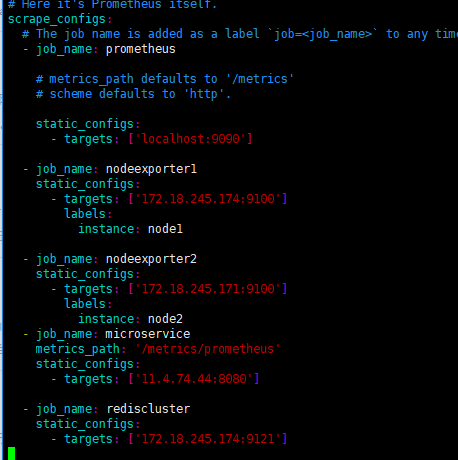
编辑配置文件: vim prometheus.yml
启动:./prometheus --config.file=prometheus.yml
3、安装grafana
on 171
sudo`` yum ``install`` https:/``/s3-us-west-2.amazonaws.com/grafana-releases/release/grafana-5.0.4-1.x86_64.rpm
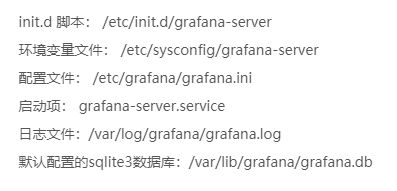
配置文件:/etc/grafana/grafana.ini
日志:/var/log/grafana/grafana.log
service grafana-server start
systemctl daemon-reload
systemctl start grafana-server
systemctl status grafana-server
systemctl enable grafana-server.service
yum install fontconfig
yum install freetype*
yum install urw-fonts
安装grafana仪表盘:
git clone https://github.com/percona/grafana-dashboards.git
cp -r grafana-dashboards/dashboards /var/lib/grafana/
dashboard.json
enable= true
path = /var/lib/grafana/dashboards
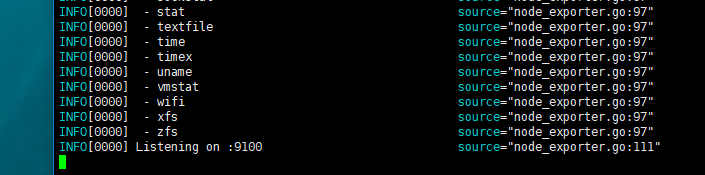
4、安装node_exporter
wget https://github.com/prometheus/node_exporter/releases/download/v0.16.0-rc.2/node_exporter-0.16.0-rc.2.linux-amd64.tar.gz
tar -vxf node_exporter-0.16.0-rc.2.linux-amd64.tar.gz
cd node_exporter-0.16.0-rc.2.linux-amd64
./nodex_exporter
5、碧油鸡
component=tsdb msg="unknown series references in WAL sample
Yup, it's an upstream bug for large index merges. After the restart, you need to cleanup the /opt/prometheus/prometheus/data/*.tmp/ directories manually.
yml文件格式真恶心
6、安装redis_exporter
wget https://github.com/oliver006/redis_exporter/releases/download/v0.15.0/redis_exporter-v0.15.0.linux-amd64.tar.gz
tar -zxvf redis_exporter-v0.15.0.linux-amd64.tar.gz
./redis_exporter -redis.addr=redis://11.4.74.44:6000,redis://11.4.74.58:6000 -redis.password=123,123
在prometheus配置文件中配置job_name
7、集成consul
