参考:PLINK | File format reference
vcftools
plink的主要功能:数据处理,质量控制的基本统计,群体分层分析,单位点的基本关联分析,家系数据的传递不平衡检验,多点连锁分析,单倍体关联分析,拷贝数变异分析,Meta分析等等。
首先必须了解plink的三种格式:bed、fam和bim。(注意:这里的bed和我们genome里的区域文件bed完全不同)
plink需要的格式一般可以从vcf文件转化而来 (顺便了解一下ped和map两种格式):
PED: Original standard text format for sample pedigree information and genotype calls. Normally must be accompanied by a .map file. 谱系信息和基因型信息。每一行是一个人。
MAP: Variant information file accompanying a .ped text pedigree + genotype table. 变异信息。每一行是一个变异 | snp。
# PED
     1 1 0 0 1  0    G G    2 2    C C
     1 2 0 0 1  0    A A    0 0    A C
     1 3 1 2 1  2    0 0    1 2    A C
     2 1 0 0 1  0    A A    2 2    0 0
     2 2 0 0 1  2    A A    2 2    0 0
     2 3 1 2 1  2    A A    2 2    A A
# MAP
     1 snp1 0 1
     1 snp2 0 2
     1 snp3 0 3
# vcf转ped和map
plink --vcf file.vcf --recode --out file
# ped和map转bed、bim和fam
plink --file test --make-bed --out test
三种格式的官方介绍
bed文件(真实的bed文件是二进制的,比较难读)
bed:Primary representation of genotype calls at biallelic variants. Must be accompanied by .bim and .fam files. Loaded with --bfile; generated in many situations, most notably when the --make-bed command is used. Do not confuse this with the UCSC Genome Browser's BED format, which is totally different. 基因型信息。所以转换后就是一个matrix,每一行是一个个体,每一列就是一个变异。其中0、1、2分别对应了aa、Aa或aA和AA。不考虑碱基型,因为我们不关注ATGC的变化。
fam:Sample information file accompanying a .bed binary genotype table. 样本信息。每一行就是一个样本。
bim:Extended variant information file accompanying a .bed binary genotype table. 每一行是一个变异,及其注释信息。
             rs4970383 rs3748592 rs9442373 rs1571150 rs6687029
2431:NA19916         2         0         0         0         1
2424:NA19835         1         0         1         2         0
2469:NA20282         1         0         1         0         1
2368:NA19703         0         0         0         2         0
2425:NA19901         1         0         1         2         2
OR
# xxd -b test.bed
00000000: 01101100 00011011 00000001 11011100 00001111 11100111 l.....
00000006: 00001111 01101011 00000001 .k.
- First two bytes 01101100 00011011 for PLINK v1.00 BED file
- Third byte is 00000001 (SNP-major) or 00000000 (individual-major)
- Genotype data, either in SNP-major or individual-major order
- New "row" always starts a new byte
- Each byte encodes up to 4 genotypes
- 10 indicates missing genotype, otherwise 0 and 1 point to allele 1 or allele 2 in the BIM file, respectively
- Bits in each byte read in reverse order
fam文件
1 2431 NA19916  0  0  1
2 2424 NA19835  0  0  2
3 2469 NA20282  0  0  2
4 2368 NA19703  0  0  1
5 2425 NA19901  0  0  2
OR
1 1 0 0 1 0
1 2 0 0 1 0
1 3 1 2 1 2
2 1 0 0 1 0
2 2 0 0 1 2
2 3 1 2 1 2
bim文件
1  1 rs4970383  0  828418  A
2  1 rs3748592  0  870101  A
3  1 rs9442373  0 1052501  C
4  1 rs1571150  0 1464167  A
5  1 rs6687029  0 1508931  C
OR
1 snp1 0 1 G A
1 snp2 0 2 1 2
1 snp3 0 3 A C
基本概念
关联分析:就是AS的中文,全称是GWAS。应用基因组中数以百万计的单核苷酸多态;SNP为分子遗传标记,进行全基因组水平上的对照分析或相关性分析,通过比较发现影响复杂性状的基因变异的一种新策略。在全基因组范围内选择遗传变异进行基因分析,比较异常和对照组之间每个遗传变异及其频率的差异,统计分析每个变异与目标性状之间的关联性大小,选出最相关的遗传变异进行验证,并根据验证结果最终确认其与目标性状之间的相关性。
连锁不平衡:LD,P(AB)= P(A)*P(B)。不连锁就独立,如果不存在连锁不平衡——相互独立,随机组合,实际观察到的群体中单倍体基因型 A和B 同时出现的概率。P (AB) = D + P (A) * P (B) 。D是表示两位点间LD程度值。
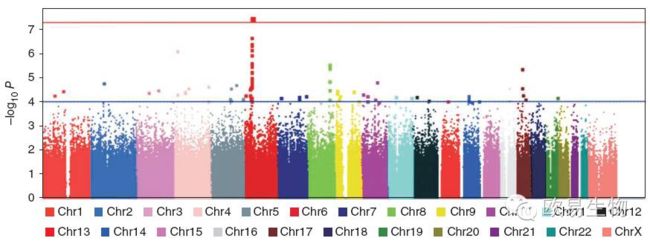
曼哈顿图:在生物和统计学上,做频率统计、突变分布、GWAS关联分析的时候,我们经常会看到一些非常漂亮的manhattan plot,能够对候选位点的分布和数值一目了然。位点坐标和pvalue。map文件至少包含三列——染色体号,SNP名字,SNP物理位置。assoc文件包含SNP名字和pvalue。haploview即可画出。
CMplot:一个R包,画曼哈顿图的。
q-q plot:分位数-分位数图,assess if a set of data plausibly came from some theoretical distribution such as a Normal or exponential.
GCAT(Genome-wide Complex Trait Analysis):在分析的时候计算LD,PCA以及关联分析。
BLUP:即最佳线性无偏预测(Best Linear Unbiased Prediction),该方法广泛用于GWAS中对多年多点表型数据分析当中,R语言中的lme4包可以对此进行分析。
常识:世界范围的人类群体,在表型上可谓千差万别,但是基因组上的差异却非常小,而且这种差异大多数表现为SNP (Single nucleotide polymorphism , 单核苷酸多态性)。
IBS:在两个或两个以上的个体当中,如果一个DNA片段具有相同的核苷酸序列,就说这个DNA片段是IBS。
IBD: 如果IBS片段是遗传自同一个祖先且中间过程没有发生过重组事件,就说这个片段是IBD。
数据表示模型:由1 和2 组成的2n个序列,每一个SNP 基因型对应两个序列。对于任意一个个体的SNP 基因型数据进行处理(忽略ACGT 的差别)如22,21,12,11 分别对应于SNP 基因型,aa aA Aa AA。然后把这些序列转换为 由0、1、2 组成的数量为n的SNP 序列,表示为:
第i个个体的SNP基因型为:
这两个个体间的第K个snp的IBS状态为:
个体i和个体j的SNP的IBS 状态值非0的区域满足一定阈值就作为候选IBD片段,可以表示为:
把N个体的数据分成case和control两组进行分析,其中case包含个l个体,control包含m个个体,然后对这两组数据分别进行评价分析,对每个SNP 得到各自的S值。差异值最大的snp位点就可能为我们的候选位点。
一些问题
这些文件中的0,1,2是什么意思?
跑跑PLINK工具
plink --bfile  --pheno  --pheno-name t16 --linear hide-covar --covar  --covar-name
 AGE,SEX,PC1,PC2,PC3,PC4 --ci 0.95 --out
--bfile  将snp文件变成二进制格式
--pheno 这里导入我们刚刚处理的性状文件
--pheno-name t16 要处理的性状名字是t16
--linear hide-covar 使用线性模型,hide-covar指的是不要对我没加入的协变量进行分析
--covar  --covar-name AGE,SEX,PC1,PC2,PC3,PC4 把我们选取的协变量加入线性回归模型中,我们选的协变量有:AGE,SEX,PC1,PC2,PC3,PC4
--ci 0.95 设置置信区间
SNP过滤问题
使用vcftools过滤:
1. MAF<0.05
vcftools --vcf test.vcf --maf 0.05 --out XX
2.完整度大于90%
vcftools --vcf test.vcf  --max-missing 0.9 --OUT XX
3.平均深度大于5
vcftools --vcf test.vc --min-meanDP 5 --out xx

注:
使用--gvcf更为快捷
使用plink过滤
1.vcf转化plink格式
vcftools --vcf test.vcf --plink --out  xxx
2.plink --noweb --file plink --geno 0.05 --maf 0.05 --hwe 0.0001 --make-bed
跟一个官网的教学,无需写代码,教学材料:Resources available for download 非常通俗,容易入门。
ped文件:谱系信息和基因型;
Contains no header line, and one line per sample with 2V+6 fields where V is the number of variants. The first six fields are the same as those in a .fam file.
The seventh and eighth fields are allele calls for the first variant in the .map file ('0' = no call); the 9th and 10th are allele calls for the second variant; and so on.
前6行就和fam文件一样,家庭id,家庭内id,性别,表型。
后面两个一组,比如第7和第8就是map中第一个snp的等位基因(人有两条染色体,每条DNA都是双链的,不考虑双链,因为有互补配对)。
fam文件:样本信息;
- Family ID ('FID')
- Within-family ID ('IID'; cannot be '0')
- Within-family ID of father ('0' if father isn't in dataset)
- Within-family ID of mother ('0' if mother isn't in dataset)
- Sex code ('1' = male, '2' = female, '0' = unknown)
- Phenotype value ('1' = control, '2' = case, '-9'/'0'/non-numeric = missing data if case/control)
map文件:突变信息;
- Chromosome code. PLINK 1.9 also permits contig names here, but most older programs do not.
- Variant identifier
- Position in morgans or centimorgans (optional; also safe to use dummy value of '0')
- Base-pair coordinate
bim文件:额外的突变信息;
- Chromosome code (either an integer, or 'X'/'Y'/'XY'/'MT'; '0' indicates unknown) or name
- Variant identifier
- Position in morgans or centimorgans (safe to use dummy value of '0')
- Base-pair coordinate (normally 1-based, but 0 ok; limited to 231-2)
- Allele 1 (corresponding to clear bits in .bed; usually minor)
- Allele 2 (corresponding to set bits in .bed; usually major)
MAF, Minor allele frequency: SNPs with a minor allele frequency of 0.05 or greater were targeted by the HapMap project. 最小等位基因频率
QC
The SNPs are currently coded according to NCBI build 36 coordinates on the forward strand.
Data quality control in genetic case-control association studies
plink可以对snp进行QC过滤,根据一些指标,比如MAF。。。
plink的结果必须要有了解,
1. 将文本的ped和map文件转化为二进制的bed、bim和fam文件;
2. 关联分析的结果,其实就是给每个人赋值一个表型,然后就做关联分析,得到每一个snp与表型的相关性,用p-value来表示,最终可以画曼哈顿图;
 CHR         SNP         BP   A1      F_A      F_U   A2        CHISQ            P           OR
   1   rs3094315     792429    G   0.1489  0.08537    A        1.684       0.1944        1.875
   1   rs4040617     819185    G   0.1354  0.08537    A        1.111       0.2919        1.678
   1   rs4075116    1043552    C  0.04167  0.07317    T       0.8278       0.3629       0.5507
   1   rs9442385    1137258    T   0.3723   0.4268    G       0.5428       0.4613       0.7966
参考:
利用PLINK进行GWAS分析(一)
GWAS的基本原理 讲得比较通俗
QQ plot图——评价你的统计模型是否合理
基于全基因组snp数据如何进行主成分分析(PCA)- GCTA


