利用arcgis api for python分析卫星影像
利用arcgis api for python分析卫星影像
arcgis api for python
jupyter notebook
scikit-mage
Landsat8卫星影像
scipy、matplotlib、scikit-image库的使用
下面的示例使用scikit-image库识别沙特阿拉伯的农场特征。然后,它统计农场的数量并报告。
数据源使用ArcGIS Online上可用的多光谱Landsat8卫星影像。
本次教程用到科学计算scipy、可视化matplotlib、以及图像处理库scikit-image。如果没有相应的库请安装,conda和pip安装皆可。
conda install scipy
conda install matplotlib
conda install scikit-image
from arcgis.gis import GIS
agol = GIS()
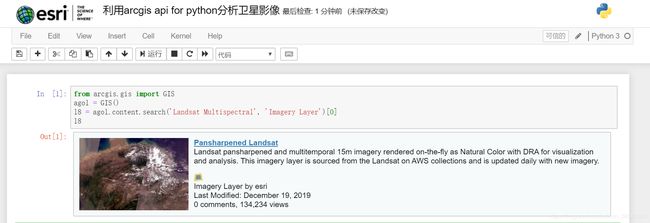
l8 = agol.content.search('Landsat Multispectral', 'Imagery Layer')[0]
l8
l8lyr = l8.layers[0]
定义 Saudi Arabia 农场范围并显示
l8lyr.extent = {'spatialReference': {'latestWkid': 3857, 'wkid': 102100},
 'type': 'extent',
 'xmax': 4296559.143733407,
 'xmin': 4219969.241391764,
 'ymax': 3522726.823081019,
 'ymin': 3492152.0117669892}
l8lyr
利用NDVI和拉伸栅格函数计算图像NDVI并拉伸显示
from arcgis.raster.functions import *
stretch(ndvi(l8lyr), stretch_type='PercentClip', min_percent=30, max_percent=70, dra=True)
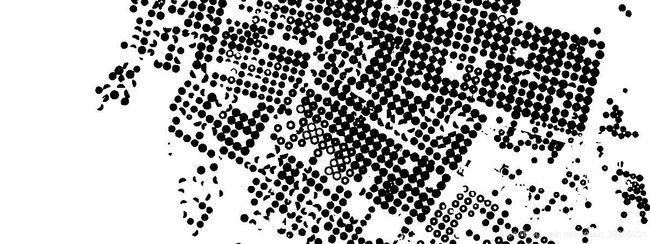
利用 matplotlib API 读取图像数据,并绘制图像。
img = stretch(ndvi(l8lyr), stretch_type='PercentClip', min_percent=30, max_percent=70, dra=True).export_image(bbox=l8lyr.extent, bbox_sr=102100, size=[1200, 450],
                       export_format='jpeg', save_folder='.', save_file='centerpivotfarms.jpg', f='image')
import numpy as np
from scipy.signal import convolve2d
import matplotlib.pyplot as plt
import matplotlib.image as mpimg

# 加载农场图像
img = mpimg.imread('centerpivotfarms.jpg')

# 图像显示
plt.imshow(img)
plt.show()
使用scikit-image进行斑点检测
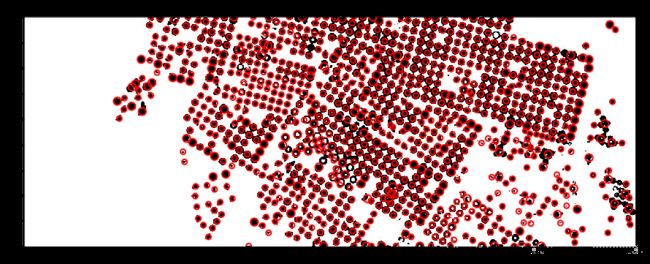
下面的代码使用scikit-image库在给定的灰度图像中查找斑点,由此检测到的农场数量,它还使用matplotlib进行可视化。
Blobs are found using the Difference of Gaussian (DoG) method.
from skimage import feature, color
import numpy as np
from scipy.signal import convolve2d
import matplotlib.pyplot as plt
import matplotlib.image as mpimg

bw = img.mean(axis=2)

fig=plt.figure(figsize = (15,15))
ax=fig.add_subplot(1,1,1)

blobs_dog = [(x[0],x[1],x[2]) for x in feature.blob_dog(-bw,
                                                        min_sigma=4,
                                                        max_sigma=8,
                                                        threshold=0.1,
                                                        overlap=0.6)]

#remove duplicates
blobs_dog = set(blobs_dog)

img_blobs = color.gray2rgb(img)

for blob in blobs_dog:
	y, x, r = blob
	c = plt.Circle((x, y), r+1, color='red', linewidth=2, fill=False)
	ax.add_patch(c)

plt.imshow(img_blobs)
plt.title('Center Pivot Farms')

plt.show()
print('Number of center pivot farms detected: ' + str(len(blobs_dog)))
Number of center pivot farms detected: 987


