pyqtgraph+Qt Designer应用
python pyqtgraph+Qt Designer应用
说明
关于pyqtgraph的中文文档大家可以参阅pyqtyraph中文文档
Qt Desigher 的文档参阅QtDesigner
本文只是简单介绍pyqtgraph结合Designer使用的一个用例
介绍
python绘图应用最广的当属matplotlib,matplotlib的界面更加美观使用也更加方便,但是pyqtgraph在数据采集及展示方面比matplotlib更加有优势,与Qt的结合也更加的流程完整。
pyqtgraph中的所有功能其实都相当于Qt中widget的概念,可以通过像其他任何Qt小部件一样嵌入来使用。
代码实例
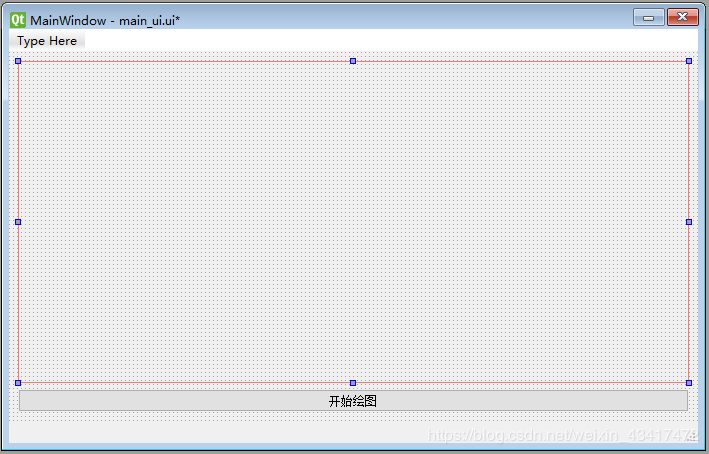
Qt Designer中创建一个简单的MainWindow,添加一个Vertical layout用于展示pyqtgraph绘图,标签命名graph_layout;
添加一个按键用来控制绘图,标签命名btn;
保存成main_ui.ui文件调用。
用PyUIC将main_ui.ui文件转成main_ui.py文件,懒得的同学也可以直接复制下面代码创建main_ui.py文件,代码如下:
# -*- coding: utf-8 -*-

# Form implementation generated from reading ui file 'main_ui.ui'
#
# Created by: PyQt5 UI code generator 5.11.3
#
# WARNING! All changes made in this file will be lost!

from PyQt5 import QtCore, QtGui, QtWidgets

class Ui_MainWindow(object):
    def setupUi(self, MainWindow):
        MainWindow.setObjectName("MainWindow")
        MainWindow.resize(834, 543)
        self.centralwidget = QtWidgets.QWidget(MainWindow)
        self.centralwidget.setObjectName("centralwidget")
        self.verticalLayout = QtWidgets.QVBoxLayout(self.centralwidget)
        self.verticalLayout.setObjectName("verticalLayout")
        self.graph_layout = QtWidgets.QVBoxLayout()
        self.graph_layout.setObjectName("graph_layout")
        self.verticalLayout.addLayout(self.graph_layout)
        self.btn = QtWidgets.QPushButton(self.centralwidget)
        self.btn.setObjectName("btn")
        self.verticalLayout.addWidget(self.btn)
        MainWindow.setCentralWidget(self.centralwidget)
        self.menubar = QtWidgets.QMenuBar(MainWindow)
        self.menubar.setGeometry(QtCore.QRect(0, 0, 834, 23))
        self.menubar.setObjectName("menubar")
        MainWindow.setMenuBar(self.menubar)
        self.statusbar = QtWidgets.QStatusBar(MainWindow)
        self.statusbar.setObjectName("statusbar")
        MainWindow.setStatusBar(self.statusbar)

        self.retranslateUi(MainWindow)
        QtCore.QMetaObject.connectSlotsByName(MainWindow)

    def retranslateUi(self, MainWindow):
        _translate = QtCore.QCoreApplication.translate
        MainWindow.setWindowTitle(_translate("MainWindow", "MainWindow"))
        self.btn.setText(_translate("MainWindow", "开始绘图"))
新建main.py文件,实现界面跟逻辑分离:
import sys
import numpy as np
from PyQt5 import QtWidgets
import pyqtgraph as pg

from main_ui import Ui_MainWindow


class MyGraphWindow(QtWidgets.QMainWindow, Ui_MainWindow):

    def __init__(self):

        super(MyGraphWindow, self).__init__()

        self.setupUi(self)  # 初始化窗口

        self.p1, self.p2 = self.set_graph_ui()  # 设置绘图窗口

        self.btn.clicked.connect(self.plot_sin_cos)  # 点击按键开始绘图
接下来添加pyqtgraph绘图函数:
    def set_graph_ui(self):

        pg.setConfigOptions(antialias=True)  # pyqtgraph全局变量设置函数,antialias=True开启曲线抗锯齿

        win = pg.GraphicsLayoutWidget()  # 创建pg layout,可实现数据界面布局自动管理

        # pg绘图窗口可以作为一个widget添加到GUI中的graph_layout,当然也可以添加到Qt其他所有的容器中
        self.graph_layout.addWidget(win)
win.addPlot(title=“sin 函数”) 函数可以添加具有坐标轴的2D绘图窗口
        p1 = win.addPlot(title="sin 函数")  # 添加第一个绘图窗口
        p1.setLabel('left', text='meg', color='#ffffff')  # y轴设置函数
        p1.showGrid(x=True, y=True)  # 栅格设置函数
        p1.setLogMode(x=False, y=False)  # False代表线性坐标轴,True代表对数坐标轴
        p1.setLabel('bottom', text='time', units='s')  # x轴设置函数
        # p1.addLegend()  # 可选择是否添加legend

        win.nextRow()  # layout换行,采用垂直排列,不添加此行则默认水平排列
        p2 = win.addPlot(title="cos 函数")
        p2.setLabel('left', text='meg', color='#ffffff')
        p2.showGrid(x=True, y=True)
        p2.setLogMode(x=False, y=False)
        p2.setLabel('bottom', text='time', units='s')
        # p2.addLegend()

        return p1, p2
创建绘图函数
    def plot_sin_cos(self):
        t = np.linspace(0, 20, 200)
        y_sin = np.sin(t)
        y_cos = np.cos(t)
        self.p1.plot(t, y_sin, pen='g', name='sin(x)', clear=True)
        self.p2.plot(t, y_cos, pen='g', name='con(x)', clear=True)
        # self.p1.legend = None  # 重新绘图是清空legend
        # self.p2.legend = None
完整main.py代码如下:
#!/usr/bin/env python
# -*- coding:utf-8 -*-
# author:dell
import sys
import numpy as np
from PyQt5 import QtWidgets
import pyqtgraph as pg

from main_ui import Ui_MainWindow


class MyGraphWindow(QtWidgets.QMainWindow, Ui_MainWindow):

    def __init__(self):

        super(MyGraphWindow, self).__init__()
        self.setupUi(self)  # 初始化窗口

        self.p1, self.p2 = self.set_graph_ui()  # 设置绘图窗口

        self.btn.clicked.connect(self.plot_sin_cos)  # 点击按键开始绘图

    def set_graph_ui(self):

        pg.setConfigOptions(antialias=True)  # pg全局变量设置函数,antialias=True开启曲线抗锯齿

        win = pg.GraphicsLayoutWidget()  # 创建pg layout,可实现数据界面布局自动管理

        # pg绘图窗口可以作为一个widget添加到GUI中的graph_layout,当然也可以添加到Qt其他所有的容器中
        self.graph_layout.addWidget(win)

        p1 = win.addPlot(title="sin 函数")  # 添加第一个绘图窗口
        p1.setLabel('left', text='meg', color='#ffffff')  # y轴设置函数
        p1.showGrid(x=True, y=True)  # 栅格设置函数
        p1.setLogMode(x=False, y=False)  # False代表线性坐标轴,True代表对数坐标轴
        p1.setLabel('bottom', text='time', units='s')  # x轴设置函数
        # p1.addLegend()  # 可选择是否添加legend

        win.nextRow()  # layout换行,采用垂直排列,不添加此行则默认水平排列
        p2 = win.addPlot(title="cos 函数")
        p2.setLabel('left', text='meg', color='#ffffff')
        p2.showGrid(x=True, y=True)
        p2.setLogMode(x=False, y=False)
        p2.setLabel('bottom', text='time', units='s')
        # p2.addLegend()

        return p1, p2

    def plot_sin_cos(self):
        t = np.linspace(0, 20, 200)
        y_sin = np.sin(t)
        y_cos = np.cos(t)
        self.p1.plot(t, y_sin, pen='g', name='sin(x)', clear=True)
        self.p2.plot(t, y_cos, pen='g', name='con(x)', clear=True)


if __name__ == '__main__':
    app = QtWidgets.QApplication(sys.argv)
    myWin = MyGraphWindow()
    myWin.show()
    sys.exit(app.exec_())
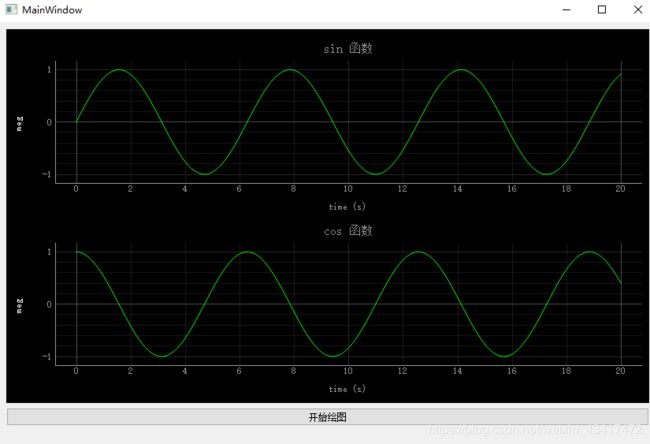
演示效果: