【人工智能与机器学习】python代码完成Fisher判别的推导
Fisher判别python推导
导入库和读取Iris数据集中的数据
from sklearn import datasets
import matplotlib.pyplot as plt
import numpy as np
import math

# prepare the data
iris = datasets.load_iris()
X = iris.data
y = iris.target
names = iris.feature_names
labels = iris.target_names
y_c = np.unique(y)
求出各类别的平均值:
np.set_printoptions(precision=4)

mean_vector = []  # 类别的平均值
for i in y_c:
    mean_vector.append(np.mean(X[y == i], axis=0))
    print('Mean Vector class %s:%s\n' % (i, mean_vector[i]))
S_W = np.zeros((X.shape[1], X.shape[1]))
for i in y_c:
    Xi = X[y == i] - mean_vector[i]
    S_W += np.mat(Xi).T * np.mat(Xi)
print('S_W:\n', S_W)

S_B = np.zeros((X.shape[1], X.shape[1]))
mu = np.mean(X, axis=0)  # 所有样本平均值
for i in y_c:
    Ni = len(X[y == i])
    S_B += Ni * np.mat(mean_vector[i] - mu).T * np.mat(mean_vector[i] - mu)
print('S_B:\n', S_B)
eigvals, eigvecs = np.linalg.eig(np.linalg.inv(S_W) * S_B)  # 求特征值,特征向量
np.testing.assert_array_almost_equal(np.mat(np.linalg.inv(S_W) * S_B) * np.mat(eigvecs[:, 0].reshape(4, 1)),
                                     eigvals[0] * np.mat(eigvecs[:, 0].reshape(4, 1)), decimal=6, err_msg='',
                                     verbose=True)
 # sorting the eigenvectors by decreasing eigenvalues
eig_pairs = [(np.abs(eigvals[i]), eigvecs[:, i]) for i in range(len(eigvals))]
eig_pairs = sorted(eig_pairs, key=lambda k: k[0], reverse=True)
W = np.hstack((eig_pairs[0][1].reshape(4, 1), eig_pairs[1][1].reshape(4, 1)))
X_trans = X.dot(W)
assert X_trans.shape == (150, 2)
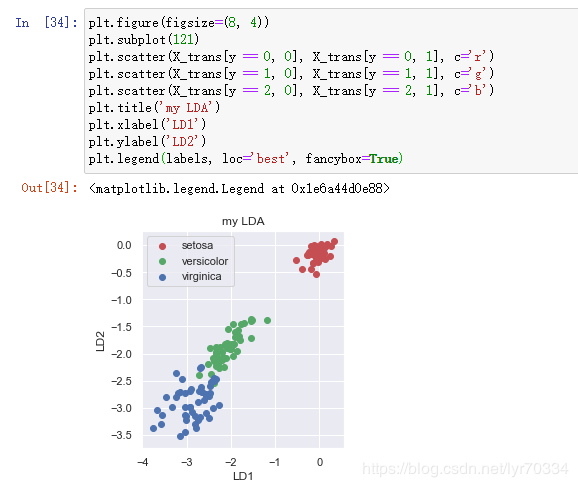
用plt将Fisher分类后表示
plt.figure(figsize=(8, 4))
plt.subplot(121)
plt.scatter(X_trans[y == 0, 0], X_trans[y == 0, 1], c='r')
plt.scatter(X_trans[y == 1, 0], X_trans[y == 1, 1], c='g')
plt.scatter(X_trans[y == 2, 0], X_trans[y == 2, 1], c='b')
plt.title('my LDA')
plt.xlabel('LD1')
plt.ylabel('LD2')
plt.legend(labels, loc='best', fancybox=True)

最后进行判别并输出正确率
直接用Iris数据集里的 划分为三类,然后判断准确率
from sklearn import discriminant_analysis
from sklearn.model_selection import train_test_split
import numpy
data = numpy.genfromtxt('iris.data', delimiter=',', usecols=(0,1,2,3))
target = numpy.genfromtxt('iris.data', delimiter=',', usecols=(4), dtype=str)
t = numpy.zeros(len(target))
t[target == 'Iris-setosa'] = 1
t[target == 'Iris-versicolor'] = 2
t[target == 'Iris-virginica'] = 3
clf = discriminant_analysis.LinearDiscriminantAnalysis()
train, test, t_train, t_test = train_test_split(data, t, test_size=0.5, random_state=0)
clf.fit(train, t_train)
print(clf.score(test,t_test))
最后输出:

参考内容:
https://blog.csdn.net/A981012/article/details/105937234
https://blog.csdn.net/pengjian444/article/details/71138003
https://blog.csdn.net/mengjizhiyou/article/details/103309372


