机器学习-1 用ARIMA预测裙摆长度 python版
第一次做机器学习,选了个最简单的,并附上python代码
参考R语言版:https://www.cnblogs.com/ECJTUACM-873284962/p/7379717.html
——2018年12月
问题描述
裙摆长度和经济学的关系有个专门的名词叫做“裙摆指数”(Hemline Index),这个理论由经济学家乔治·泰勒(George W.Taylor)在1926年首次提出,他发现,女性的裙摆越长,股市就越低迷;相反,女性裙摆越短,股市就越容易出现高涨的趋势。
数据
- 数据来源:http://robjhyndman.com/tsdldata/roberts/skirts.dat
- 数据描述: Diameter of skirts at hem, 1866-1911, annual
- 数据特点:非季节性的时间序列
将数据如下图保存为csv文件
时间序列,就是按时间顺序排列的,随时间变化的数据序列。生活中各行各业有太多时间序列的数据了,销售额,顾客数,访问量,股价,油价,GDP,气温。。。
时间序列的平稳性:
- 随机过程的特征有均值、方差、协方差等。
- 如果随机过程的特征随着时间变化,则此过程是非平稳的;
- 相反,就称此过程是平稳的。下图左边非平稳,右边平稳
预测方法介绍——ARIMA模型
ARIMA(p,d,q)模型
- 其中 d 是差分的阶数,用来得到平稳序列。
- AR是自回归,p为相应的自回归项。
- MA为移动平均,q为相应的移动平均项数。
优点: 模型十分简单,只需要内生变量
缺点:
- 要求时序数据是稳定的
- 只能捕捉线性关系
建模流程
- 获取数据
- 进行ADF检验,判断是否平稳数据,如果是跳到step4
- 如果不平稳就进行差分,返回step2,直到平稳,d就等于差分的阶
- 画出ACF、PACF图判断p、q
- 如果有多组p、d、q进行BIC信息准则检验,选取BIC值最小的p、d、q组合
预测方法介绍——自回归模型AR
描述当前值与历史值之间的关系,用变量自身的历史时间数据对自身进行预测
yt是当前值,μ是常数项,P是阶数,γi是自相关系数,ϵt是误差 (当前值距p天前的值的关系)
自回归模型的限制
- 用自身的数据进行预测
- 必须具有平稳性
- 必须具有相关性,如果自相关系数(γi)小于0.5,则不宜采用
- 自回归只适用于预测与自身前期相关的现象
预测方法介绍——移动平均模型MA和ARMA模型
移动平均模型MA
自回归移动平均模型ARMA
预测方法介绍——ADF检验
对数据或者数据的n阶差分进行平稳检验,即单位根检验。即序列中存在单位根过程就不平稳
主要看:
- P-value是否非常接近0,证明无单位根,也就是说序列平稳。
- 反之比0.05大很多则证明非平稳
- 接近于0.05就要通过τ统计量和临界值进行对比。τ值比临界值小,就证明平稳,反之就是非平稳。这里的1%,5%,10%对应的是99%,95%,90%置信区间。
预测方法介绍——ACF、PACF
自相关函数(ACF)
有序的随机变量序列与其自身相比较自相关函数反映了同一序列在不同时序的取值的相关性
偏自相关函数(PACF)
- 对于一个平稳AR(p)模型,求出滞后k自相关系数p(k)时 实际上得到的并不是x(t)与x(t-k)之间单纯的相关关系
- x(t)同时还会受到中间k-1个随机变量x(t-1)、x(t-2)……、x(t-k+1)的影响,而这k-1个随机变量又都和x(t-k)具有相关关系,所以自相关系数p(k)里实际掺杂了其他变量对x(t)与x(t-k)的影响
- 剔除了中间k-1个随机变量x(t-1)、x(t-2)、……、x(t-k+1)的干扰之后 x(t-k)对x(t)影响的相关程度
预测方法介绍——BIC
BIC即贝叶斯信息准则,注意规则只是刻画了用某个模型之后相对“真实模型”的信息损失【因为不知道真正的模型是什么样子,所以训练得到的所有模型都只是真实模型的一个近似模型】,所以用这些规则不能说明某个模型的精确度,即三个模型A, B, C,在通过这些规则计算后,我们知道B模型是三个模型中最好的,但是不能保证B这个模型就能够很好地刻画数据,因为很有可能这三个模型都是非常糟糕的,B只是烂苹果中的相对好的苹果而已。BIC值越小,说明越好。
BIC=-2 ln(L) + ln(n)*k
其中L是在该模型下的最大似然,n是数据数量,k是模型的变量个数。
代码
数据处理
# -*- coding:utf-8 -*-
import numpy as np
import pandas as pd
import matplotlib.pylab as plt
import statsmodels.tsa.stattools as st
from statsmodels.tsa.arima_model import ARMA, ARIMA
from sklearn.metrics import mean_squared_error
from statsmodels.graphics.tsaplots import plot_acf, plot_pacf

# 数据读取
def parser(x):
    return pd.datetime.strptime(x, '%Y')

ts = pd.read_csv('./skirts.csv', header=0, index_col=0, date_parser=parser,
                 squeeze=True, parse_dates=[0])
# ts_log = np.log(ts) #如果想要更加平稳的数据可对数据进行对数化

# 一阶差分
diff1 = ts.diff(1)[1:]

# 二阶差分
diff2 = diff1.diff(1)[1:]

# 画出差分图
fig = plt.figure()
fig.add_subplot(311)
ts.plot(color='blue', label='ORIGIN')
plt.xlim('1866-01-01', '1911-01-01')
plt.legend(loc='best')
fig.add_subplot(312)
plt.plot(diff1, label='diff1')
plt.xlim('1866-01-01', '1911-01-01')
plt.legend(loc='best')
fig.add_subplot(313)
plt.plot(diff2, label='diff2')
plt.xlim('1866-01-01', '1911-01-01')
plt.legend(loc='best')
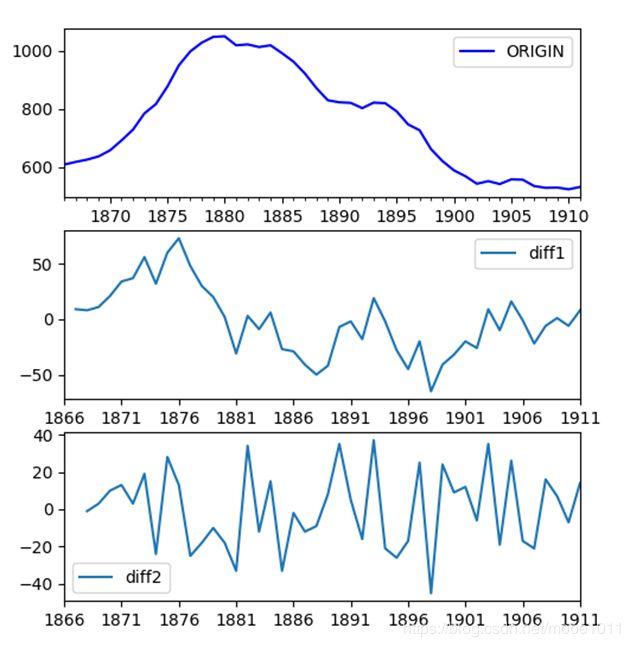
画出下面的图,从上到下分别是原图,一阶差分,二阶差分
ADF检验
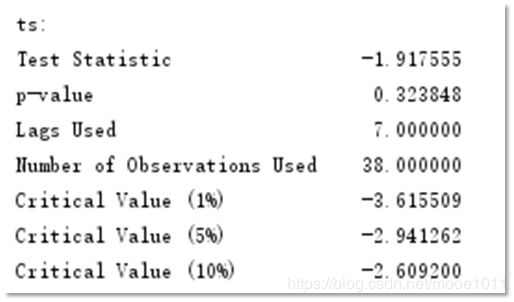
P-value值接近0.05, τ统计量的值比临界值小,就证明平稳,可见确定ARMIA模型为ARIMA(p,2,q)
# adftest
def adf_test(ts):
    adftest = st.adfuller(ts, autolag='AIC')
    adf_res = pd.Series(adftest[0:4], index=['Test Statistic', 'p-value', 'Lags Used', 'Number of Observations Used'])
    for key, value in adftest[4].items():
        adf_res['Critical Value (%s)' % key] = value
    return adf_res

# adf检验
print('ts:')
print(adf_test(ts))
print('diff1:')
print(adf_test(diff1))
print('diff2:')
print(adf_test(diff2))
画出ACF、PACF图
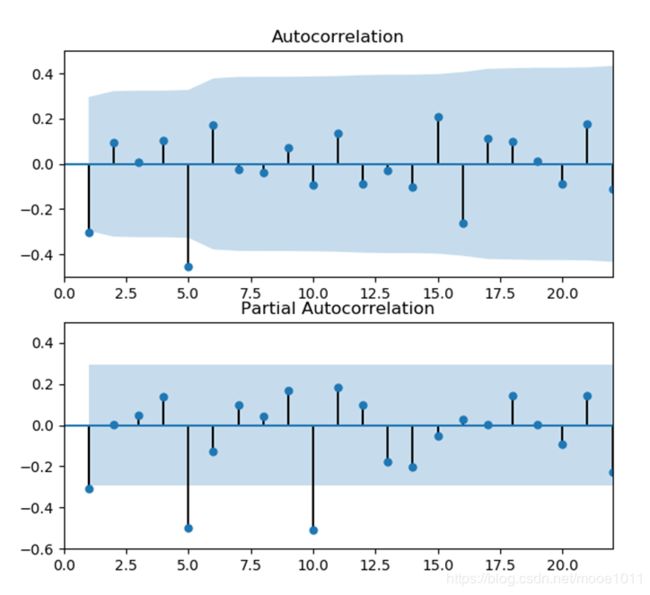
ACF显示滞后1阶自相关值基本没有超过边界值,虽然5阶自相关值超出边界,那么很可能属于偶然出现的。 p选1
同理根据PACF,q值选5。 所以我们确定ARMIA模型为ARIMA(1,2,5)
此外,q值也可选1,5和10可以认为是偶然的
# 画出acf,pacf图
fig = plt.figure()
ax1 = fig.add_subplot(211)
plot_acf(diff2, ax=ax1)
plt.xlim(0, 22)
plt.ylim(-0.5, 0.5)
ax2 = fig.add_subplot(212)
plot_pacf(diff2, ax=ax2)
plt.xlim(0, 22)
plt.ylim(-0.6, 0.5)
用BIC选出p、q值
#  p,q值
order = st.arma_order_select_ic(diff2, max_ar=4, max_ma=4, ic=['aic', 'bic'])
# # 打印出p,q值
# print('aic',order.aic_min_order)
print('bic', order.bic_min_order)
model = ARMA(ts, order=order.bic_min_order)
result_arma = model.fit(disp=-1, method='css')
预测
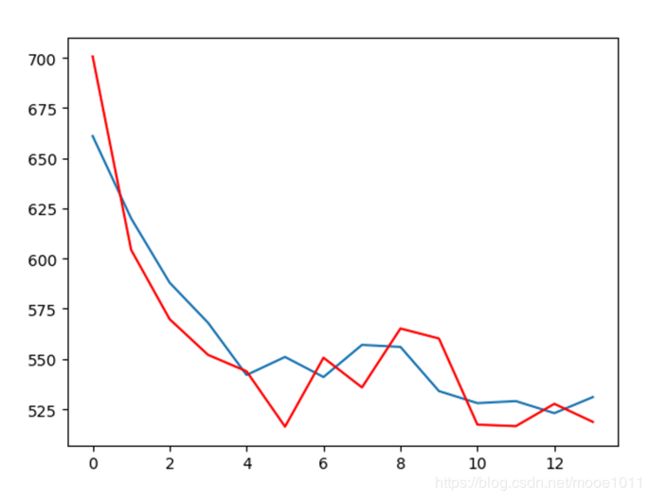
将数据集按7:3的比例划分为训练集和验证集。红色为预测值,蓝色为实际值
# 预测
X = ts.values
size = int(len(X) * 0.7)
train, test = X[0:size], X[size:len(X)]
history = [x for x in train]
predictions = list()
for t in range(len(test)):
    model = ARIMA(history, order=(1, 2, 0))
    model_fit = model.fit(disp=0)
    output = model_fit.forecast()
    yhat = output[0]
    predictions.append(yhat)
    obs = test[t]
    history.append(obs)
    print('predicted=%f, expected=%f' % (yhat, obs))
error = mean_squared_error(test, predictions)
print('Test MSE: %.3f' % error)

plt.plot(test)
plt.plot(predictions, color='red')
plt.show()
核密度、残差检验
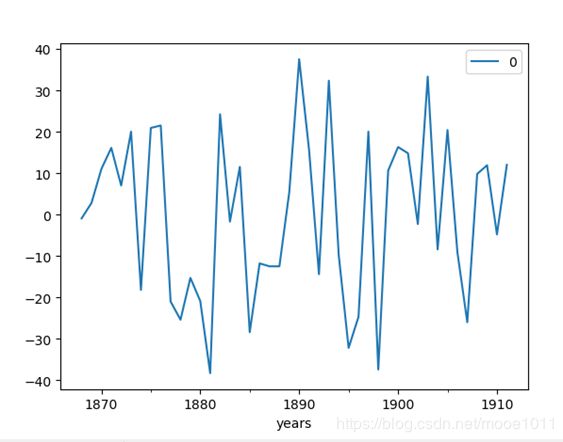
左边核密度,右边残差图
# 残差、核密度检验
model = ARIMA(ts, order=(1, 2, 0))
model_fit = model.fit(disp=0)
print(model_fit.summary())
residuals = pd.DataFrame(model_fit.resid)
residuals.plot()
plt.show()
residuals.plot(kind='kde')
plt.show()
print(residuals.describe())
