指针式仪表的自动读数与识别
指针式仪表的自动读数与识别
- 前言
- 概述
- 步骤概括
- 1.仪表图像预处理
- 2.刻度线提取
- 2.1轮廓查找
- 2.2面积筛选,长宽比,距离
- 2.3刻度线轮廓拟合直线
- 3.指针轮廓提取
- 3.1 霍夫直线检测原理
- 4.结果
- 5.Pyqt5
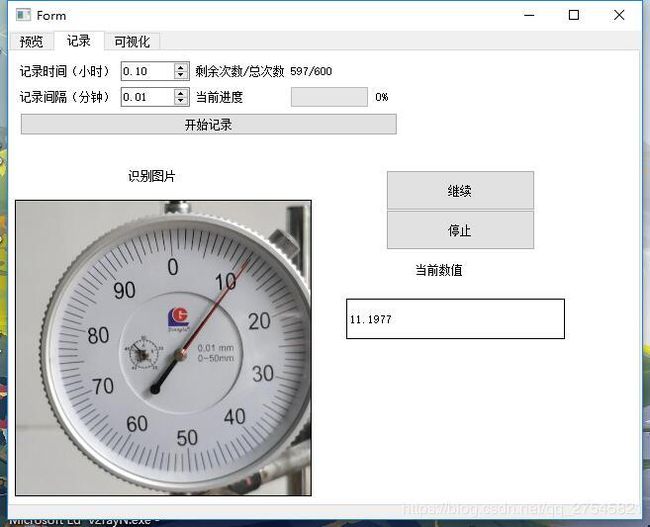
- 5.1功能
- 测试
- 总结
- 检测程序
前言
本文讲述了指针仪表示数读取的过程与方法,灵感来自实验室的长时间数据记录带来的枯燥,自学了python,Pyqt5,opencv的库,断断续续做了大半年,其实真正着手也没有那么困难,只不过在一些处理方法是来回选择,希望达到更好的效果,由于疫情的影响不能回校,采用深度学习的方法被迫泡汤,眼看着大创截至期限快到,先出第一个版本。
概述
多年以来仪表识别的难点一直存在,摄像直读抄表,俗称“视觉抄表”,是一种通过手机或终端设备对水电气表拍照后利用图像识别算法将仪表照片自动识别为读数的智能抄表方案,具有使用范围广、安装简单、有图有真相、易于使用等特点。仪表表盘图像识别算法是视觉抄表中至关重要的一环,早在21世纪初,便有不少专家学者开始从事这一研究工作。然而,由于当时的算法识别率低、硬件成本高、通信基础设施不完善等诸多原因,视觉抄表一直停滞在研究阶段,并没有大规模普及开来。
随着NB-IoT网络、高性价比芯片等相关技术的发展为之提供了硬件基础,深度学习等图像识别技术的快速发展为之提供了软件基础,视觉抄表这一直观方法重新登上历史舞台,引起了业内人士的广泛关注。快速赋能离线表计,让表网数据更完整,有图有真相的特点彻底解决了买卖双方信用纠纷问题,让决策更可信。如今,在存量市场有绝对优势的视觉抄表方案,毋庸置疑成为了仪表智能化2.0时代不可或缺的产物。
受益于深度学习技术的出现,摄像直读抄表的识别精度相对于本世纪初得到了很大的提升,然而为了实现大规模商业化应用,视觉抄表方案存在大量工程化问题需要解决。例如,摄像终端硬件如何做到低功耗、低成本、高传输成功率、结构高适配,同时还能有效应对恶劣复杂的现场环境;算法识别结果的准确率如何做到保障,如何对异常数据进行快速稽查等等。
一般的,视觉抄表的流程可概括如下:
1、在仪表上外挂式安装拍照采集设备;
2、设置采集终端定期启动拍照;
3、图像通过无线网络上传至服务端;
4、通过图像识别算法,将照片读数转化成数值结果;
5、实现远程抄表、数据分析、收费管理等上层应用服务。
指针仪表1.0版本 -----传统机器视觉
主要环境依赖
开发语言:python 3.6
界面处理库:Pyqt5
图像处理库:opencv
都是用pip安装最新版即可
步骤概括
- 零刻度点标注
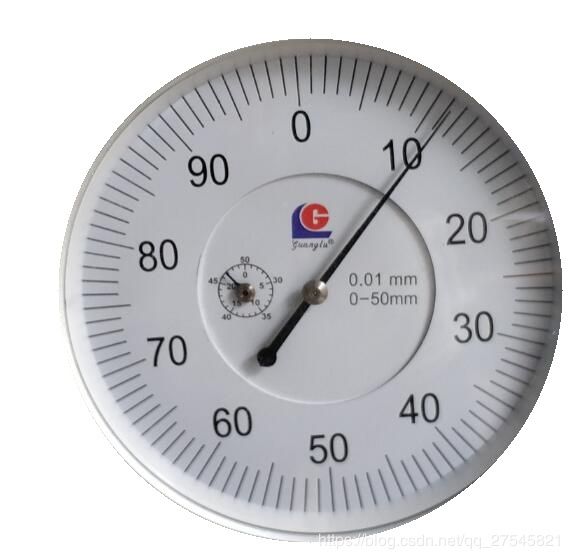
1.提取表盘
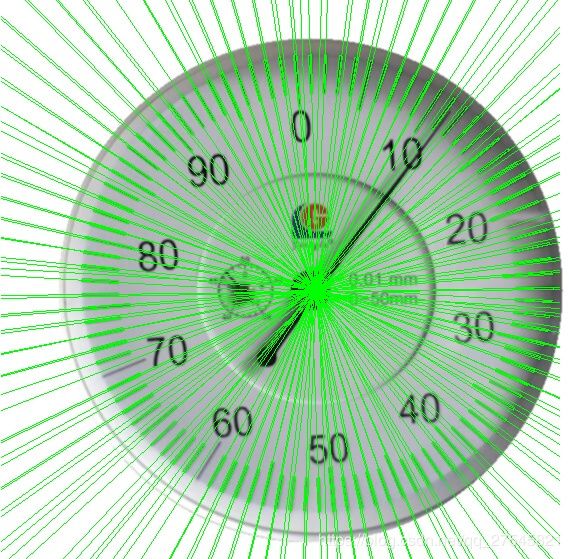
2.刻度线轮廓拟合直线,求出交点作为圆心
3.根据指针轮廓找直线,提取多条直线
4.多条直线的轮廓拟合成一条直线,即指针
5.根据分度值求值
1.仪表图像预处理
裁剪出表盘,去除背景
均值滤波+灰度转换+概率霍夫圆检测
dst = cv2.pyrMeanShiftFiltering(input, 10, 100)

cimage = cv2.cvtColor(dst, cv2.COLOR_BGR2GRAY)

circles = cv2.HoughCircles(cimage, cv2.HOUGH_GRADIENT, 1, 80, param1=100, param2=20, minRadius=80, maxRadius=0)
创建mask提取圆形区域
circle = np.ones(input.shape, dtype="uint8")
circle = circle * 255
cv2.circle(circle, (c_x, c_y), int(r_1), 0, -1)
bitwiseOr = cv2.bitwise_or(input, circle)
- 难点:概率霍夫圆检测参数要多改变数值去试
–标准霍夫圆检测
霍夫圆变换的基本思路是认为图像上每一个非零像素点都有可能是一个潜在的圆上的一点,跟霍夫线变换一样,也是通过投票,生成累积坐标平面,设置一个累积权重来定位圆。
在笛卡尔坐标系中圆的方程为:
( x − a ) 2 + ( y − b ) 2 = r 2 \left ( x-a \right )^{2}+\left ( y-b \right )^{2}=r^{2} (x−a)2+(y−b)2=r2
其中(a,b)是圆心,r是半径,也可以表述为:
x = a + r c o s θ y = b + r s i n θ x=a+rcos\theta \quad y=b+rsin\theta x=a+rcosθy=b+rsinθ
a = x − r c o s θ b = y − r s i n θ a=x-rcos\theta \quad b=y-rsin\theta a=x−rcosθb=y−rsinθ
所以在abr组成的三维坐标系中,一个点可以唯一确定一个圆。
而在笛卡尔的xy坐标系中经过某一点的所有圆映射到abr坐标系中就是一条三维的曲线:经过xy坐标系中所有的非零像素点的所有圆就构成了abr坐标系中很多条三维的曲线。
在xy坐标系中同一个圆上的所有点的圆方程是一样的,它们映射到abr坐标系中的是同一个点,所以在abr坐标系中该点就应该有圆的总像素N0个曲线相交。通过判断abr中每一点的相交(累积)数量,大于一定阈值的点就认为是圆。
–Opencv霍夫圆变换
Opencv霍夫圆变换对标准霍夫圆变换做了运算上的优化。它采用的是“霍夫梯度法”。它的检测思路是去遍历累加所有非零点对应的圆心,对圆心进行考量。圆心一定是在圆上的每个点的模向量上,即在垂直于该点并且经过该点的切线的垂直线上,这些圆上的模向量的交点就是圆心。
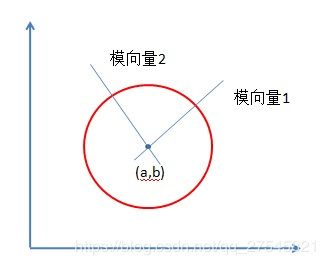
霍夫梯度法就是要去查找这些圆心,根据该“圆心”上模向量相交数量的多少,根据阈值进行最终的判断。
 HoughCircles(image, method, dp, minDist, circles=None, param1=None, param2=None, minRadius=None, maxRadius=None)
1.image:输入图像 (灰度图)

2.method:指定检测方法. 现在OpenCV中只有霍夫梯度法,加快速度

3.dp:累加器图像的反比分辨=1,默认即可

4.minDist =80 检测到圆心之间的最小距离,这是一个经验值。这个大了,那么多个圆就是被认为一个圆。

5.param_1 = 100: Canny边缘函数的高阈值

6.param_2 = 20: 圆心检测阈值.根据你的图像中的圆大小设置,当这张图片中的圆越小,那么此值就设置应该被设置越小。

当设置的越小,那么检测出的圆越多,在检测较大的圆时则会产生很多噪声。所以要根据检测圆的大小变化。

7.min_radius = 80: 能检测到的最小圆半径, 默认为0.

8.max_radius = 0: 能检测到的最大圆半径, 默认为0
2.刻度线提取
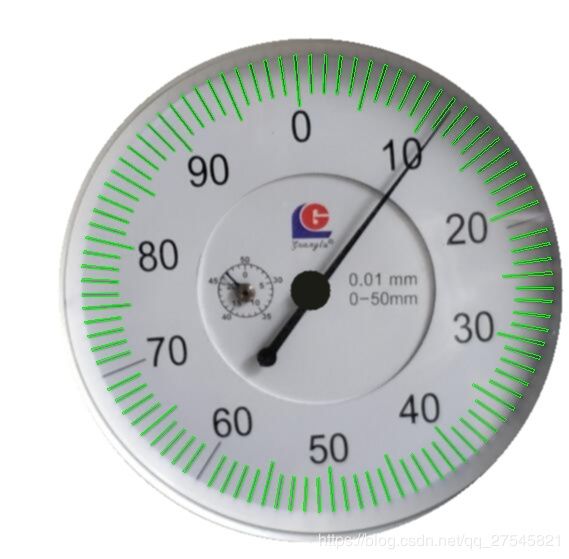
通过轮廓查找,可以将所有黑色部分(刻度线,指针,干扰点)区域找出,根据刻度线的特点从以下几个方面讨论:
距离:刻度线中心点在半径r范围附近
长宽比:刻度线是细长区域,长宽比例为矩形,达到1:4以上
面积:通过上述筛选,对选出轮廓进行面积统计,刻度线面积占大多数,取统计中值附近进行二次筛选
2.1轮廓查找
img = cv2.GaussianBlur(img, (3, 3), 0)
gray = cv2.cvtColor(img, cv2.COLOR_BGR2GRAY)
# cv2.imshow('dds', img)
# ret, binary = cv2.threshold(~gray, 0, 255, cv2.THRESH_BINARY | cv2.THRESH_OTSU)
binary = cv2.adaptiveThreshold(~gray, 255,
                               cv2.ADAPTIVE_THRESH_GAUSSIAN_C, cv2.THRESH_BINARY, 15, -10)	#二值化

aa, contours, hier = cv2.findContours(binary, cv2.RETR_LIST, cv2.CHAIN_APPROX_SIMPLE)#轮廓查找
2.2面积筛选,长宽比,距离
 for xx in contours:
        rect = cv2.minAreaRect(xx)
        # print(rect)
        a, b, c = rect
        w, h = b
        w = int(w)
        h = int(h)
        ''' 满足条件:“长宽比例”,“面积”'''
        if h == 0 or w == 0:
            pass
        else:
            dis = mential.ds_ofpoint(self=0, a=ca, b=a)

            if (incircle[0] < dis and incircle[1] > dis):#距离
                localtion.append(dis)
                if h / w > 4 or w / h > 4: #长宽比例
                    cntset.append(xx)#刻度线轮廓
                    cntareas.append(w * h)
            else:
                if w > r_1 / 2 or h > r_1 / 2:
                    needlecnt.append(xx)#指针轮廓
                    needleareas.append(w * h)
    cntareas = np.array(cntareas)
    nss = remove_diff(cntareas)  # 中位数,上限区
    new_cntset = []
    for i, xx in enumerate(cntset): #面积筛选
        if (cntareas[i] <= nss * 1.5 and cntareas[i] >= nss * 0.8):
            new_cntset.append(xx)
2.3刻度线轮廓拟合直线
刻度线拟合
    for xx in new_cntset:
        rect = cv2.minAreaRect(xx)
        box = cv2.boxPoints(rect)
        box = np.int0(box)
        cv2.polylines(img, [box], True, (0, 255, 0), 1)  # pic
        output = cv2.fitLine(xx, 2, 0, 0.001, 0.001)
        k = output[1] / output[0]
        k = round(k[0], 2)
        b = output[3] - k * output[2]
        b = round(b[0], 2)
        x1 = 1
        x2 = gray.shape[0]
        y1 = int(k * x1 + b)
        y2 = int(k * x2 + b)
        cv2.line(img, (x1, y1), (x2, y2), (0, 255, 0), 1)
        kb.append([k, b])  # 求中心点的点集[k,b]
    point_list = findpoint(kb,path) #kb是线集
    cx, cy = countpoint(point_list,path)
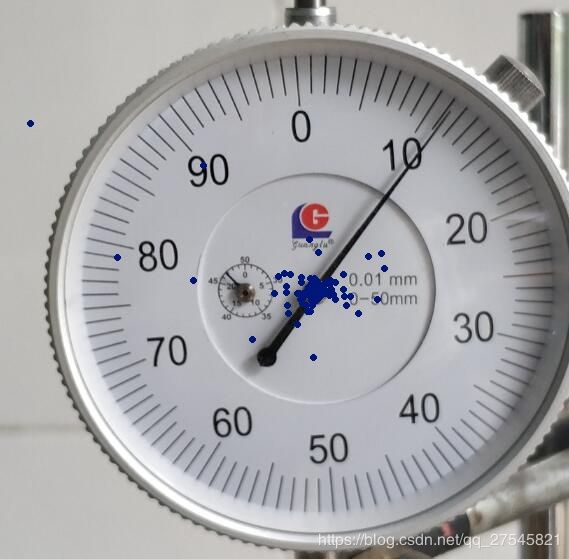
将线集随机抽取一半分成两个部分,求两部分线集的交点,储存到point_list
def findpoint(kb,path):
    img = cv2.imread(path)
    w, h, c = img.shape
    point_list = []
    if len(kb) > 2:
        random.shuffle(kb)
        lkb = int(len(kb) / 2)
        kb1 = kb[0:lkb]
        kb2 = kb[lkb:(2 * lkb)]
        # print('len', len(kb1), len(kb2))
        kb1sample = sample(kb1, int(len(kb1) / 2))
        kb2sample = sample(kb2, int(len(kb2) / 2))
    else:
        kb1sample = kb[0]
        kb2sample = kb[1]

    for i, wx in enumerate(kb1sample):
        # for wy in kb2:
        for wy in kb2sample:
            k1, b1 = wx
            k2, b2 = wy
            # print('kkkbbbb',k1[0],b1[0],k2[0],b2[0])
            # k1-->[123]
            try:
                if (b2 - b1) == 0:
                    b2 = b2 - 0.1
                if (k1 - k2) == 0:
                    k1 = k1 - 0.1
                x = (b2 - b1) / (k1 - k2)
                y = k1 * x + b1
                x = int(round(x))
                y = int(round(y))
            except:
                x = (b2 - b1 - 0.01) / (k1 - k2 + 0.01)
                y = k1 * x + b1
                x = int(round(x))
                y = int(round(y))
            # x,y=solve_point(k1, b1, k2, b2)
            if x < 0 or y < 0 or x > w or y > h:
                break
            point_list.append([x, y])
            cv2.circle(img, (x, y), 2, (122, 22, 0), 2)
    # print('point_list',point_list)
    if len(kb) > 2:
        # cv2.imshow(pname+'_pointset',img)
        cv2.imwrite(pname + '_pointset' + ptype, img)
    return point_list
输入点集,创建一个图像大小的二维0数组,二维数组中点的位置加1,最后找值最大的点,即为圆心
def countpoint(pointlist,path):
    # pointlist=[[1,2],[36,78],[36,77],[300,300],[300,300]]
    img = cv2.imread(path, 0)
    h, w = img.shape
    pic_list = np.zeros((h, w))
    for point in pointlist:
        # print('point',point)
        x, y = point
        if x < w and y < h:
            pic_list[y][x] += 1
    # print(pic_list)
    cc = np.where(pic_list == np.max(pic_list))
    # print(cc,len(cc))
    y, x = cc
    cc = (x[0], y[0])
    cv2.circle(img, cc, 2, (32, 3, 240), 3)
    # cv2.imshow(pname + '_center_point', img)
    cv2.imwrite(pname + '_center_point' + ptype, img)
    return cc
3.指针轮廓提取
去除掉刻度线和杂点后,剩余的轮廓只含有刻度线和圆盘
此时可以用直接使用霍夫直线检测,但是圆盘可能会存在一部分干扰,可用预处理中的mask方法去掉圆盘。
在2.刻度线提取中已经将刻度线提取出来,剩下的包换指针区域
3.1 霍夫直线检测原理
Hough直线检测的基本原理在于利用点与线的对偶性,在我们的直线检测任务中,即图像空间中的直线与参数空间中的点是一一对应的,参数空间中的直线与图像空间中的点也是一一对应的。这意味着我们可以得出两个非常有用的结论:
1)图像空间中的每条直线在参数空间中都对应着单独一个点来表示;
2)图像空间中的直线上任何一部分线段在参数空间对应的是同一个点。
因此Hough直线检测算法就是把在图像空间中的直线检测问题转换到参数空间中对点的检测问题,通过在参数空间里寻找峰值来完成直线检测任务。
霍夫变换运用两个坐标空间之间的变换,将在一个空间中具有相同形状的曲线或直线映射到另一个坐标空间的一个点上形成峰值,从而把检测任意形状的问题转化为统计峰值问题。
霍夫变换直线检测(Line Detection)原理及示例
    circle = np.zeros(img.shape, dtype="uint8")
    cv2.circle(circle, (cx, cy), int(r), 255, -1)
    mask = cv2.bitwise_and(img, circle)
    # cv2.imshow('m', mask)

    kernel = np.ones((3, 3), np.uint8)
    mask = cv2.dilate(mask, kernel, iterations=1)
    # erosion = cv2.erode(mask, kernel, iterations=1)
    # cv2.imshow('1big', mask)

    lines = cv2.HoughLinesP(mask, 1, np.pi / 180, 100, minLineLength=int(r / 2), maxLineGap=2)
    nmask = np.zeros(img.shape, np.uint8)
    # lines = mential.findline(self=0, cp=[x, y], lines=lines)
    # print('lens', len(lines))
    for line in lines:
        x1, y1, x2, y2 = line[0]
        cv2.line(nmask, (x1, y1), (x2, y2), 100, 1, cv2.LINE_AA)
再查找直线轮廓,指针细化,找指针的骨架
    aa, cnts, hier = cv2.findContours(nmask, cv2.RETR_LIST, cv2.CHAIN_APPROX_SIMPLE)
    areass = [cv2.contourArea(x) for x in cnts]
    # print(len(areass))
    i = areass.index(max(areass))
    # print('contours[i]',contours[i])
    # cv2.drawContours(img, contours[i], -1, (10,20,250), 1)
    # cv2.imshow('need_next', img)
    cnt = cnts[i]
    output = cv2.fitLine(cnt, 2, 0, 0.001, 0.001)
    k = output[1] / output[0]
    k = round(k[0], 2)
    b = output[3] - k * output[2]
    b = round(b[0], 2)
    x1 = cx
    x2 = axit[0]
    y1 = int(k * x1 + b)
    y2 = int(k * x2 + b)
    cv2.line(oimg, (x1, y1), (x2, y2), (0, 23, 255), 1, cv2.LINE_AA)
    cv2.line(oimg, (x1, y1), (x0,y0), (0, 23, 255), 1, cv2.LINE_AA)
    cv2.circle(oimg, (x1,y1), 2, (0, 123, 255), -1)
    # cv2.imshow('msss', oimg)
4.结果
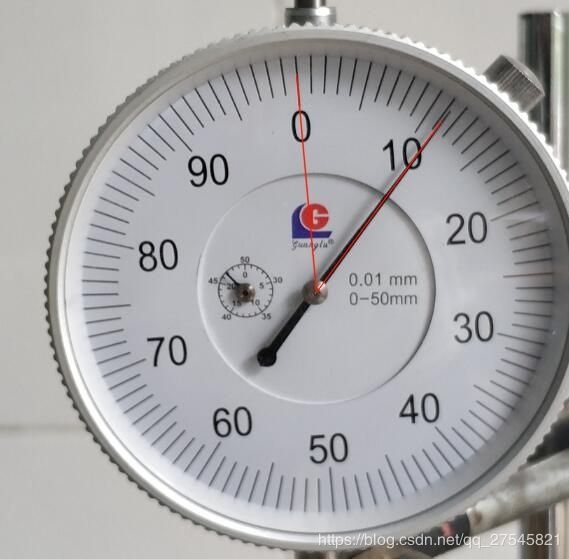
角度:11.332886626198873
时间:0:00:00.506669
5.Pyqt5
界面设计就没什么好说了
5.1功能
1.从摄像头读取照片
2.设置记录的时间和间隔
3.生成csv表格
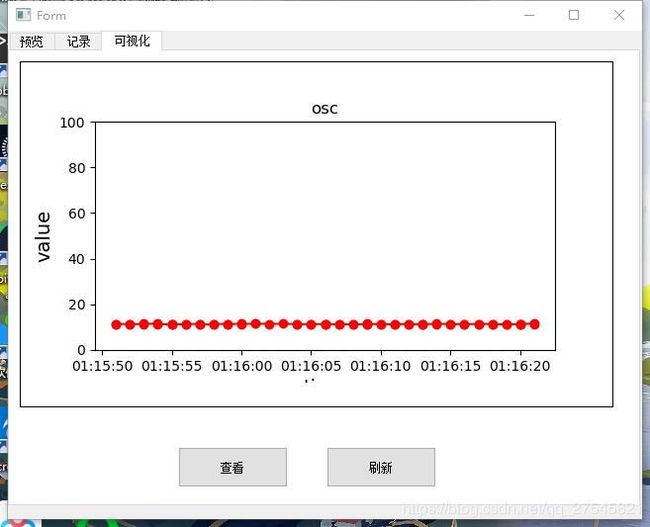
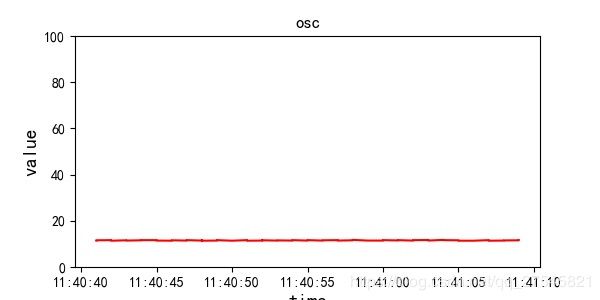
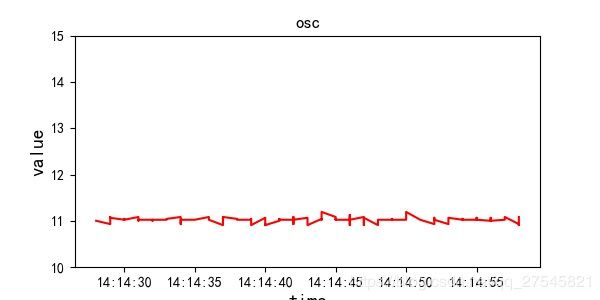
4.可视化折线图
测试
总结
自学的python,很多代码不扎实,不太会写,有很多冗余的步骤,由于window中的pyhton,opencv库也不是编译的,效率较低,还有很多优化的空间。
检测程序
# -*- coding: utf-8 -*-
# @Time    : 2020/5/3 15:27
# @Author  : luyekang
# @Email   : [email protected]
# @File    : meter.py
# @Software: PyCharm
import datetime
import pandas as pd
from random import sample
import cv2
from scipy import stats
import numpy as np
import matplotlib.pyplot as plt
from collections import Counter
import random
from sympy import *
import math


class mential():
    def get_max_point(self, cnt):
        lmost = tuple(cnt[cnt[:, :, 0].argmin()][0])
        rmost = tuple(cnt[cnt[:, :, 0].argmax()][0])
        tmost = tuple(cnt[cnt[:, :, 1].argmin()][0])
        bmost = tuple(cnt[cnt[:, :, 1].argmax()][0])
        pmost = [lmost, rmost, tmost, bmost]
        return pmost

    def distance(self, pmost, centerpoint):
        cx, cy = centerpoint
        distantion = []
        for point in pmost:
            dx, dy = point
            distantion.append((cx - dx) ** 2 + (cy - dy) ** 2)
        index_of_max = distantion.index((max(distantion)))
        return index_of_max

    def ds_ofpoint(self, a, b):
        x1, y1 = a
        x2, y2 = b
        distances = int(sqrt((x1 - x2) ** 2 + (y1 - y2) ** 2))
        return distances

    def findline(self, cp, lines):
        x, y = cp
        cntareas = []
        for line in lines:
            x1, y1, x2, y2 = line[0]
            aa = sqrt(min((x1 - x) ** 2 + (y1 - x) ** 2, (x2 - x) ** 2 + (y2 - x) ** 2))
            if (aa < 50):
                cntareas.append(line)
        print(cntareas)
        return cntareas


def angle(v1, v2):
    dx1 = v1[2] - v1[0]
    dy1 = v1[3] - v1[1]
    dx2 = v2[2] - v2[0]
    dy2 = v2[3] - v2[1]
    angle1 = math.atan2(dy1, dx1)
    angle1 = angle1 * 180 / math.pi
    # print(angle1)
    angle2 = math.atan2(dy2, dx2)
    angle2 = angle2 * 180 / math.pi
    # print(angle2)
    if angle1 * angle2 >= 0:
        included_angle = abs(angle1 - angle2)
    else:
        included_angle = abs(angle1) + abs(angle2)
        # if included_angle > 180:
        #     included_angle = 360 - included_angle
    return included_angle


def get_mode(arr):
    while 0 in arr:
        arr.remove(0)
    mode = []
    arr_appear = dict((a, arr.count(a)) for a in arr)  # 统计各个元素出现的次数
    if max(arr_appear.values()) == 1:  # 如果最大的出现为1
        arrs = np.array(arr)
        oo = np.median(arrs)
        return oo
    else:
        for k, v in arr_appear.items():  # 否则,出现次数最大的数字,就是众数
            if v == max(arr_appear.values()):
                mode.append(k)
    return mode


def remove_diff(deg):
    """
    :funtion :
    :param b:
    :param c:
    :return:
    """
    if (True):
        # new_nums = list(set(deg)) #剔除重复元素
        mean = np.mean(deg)
        var = np.var(deg)
        # print("原始数据共", len(deg), "个\n", deg)
        '''
        for i in range(len(deg)):
            print(deg[i],'→',(deg[i] - mean)/var)
            #另一个思路,先归一化,即标准正态化,再利用3σ原则剔除异常数据,反归一化即可还原数据
        '''
        # print("中位数:",np.median(deg))
        percentile = np.percentile(deg, (25, 50, 75), interpolation='midpoint')
        # print("分位数:", percentile)
        # 以下为箱线图的五个特征值
        Q1 = percentile[0]  # 上四分位数
        Q3 = percentile[2]  # 下四分位数
        IQR = Q3 - Q1  # 四分位距
        ulim = Q3 + 2.5 * IQR  # 上限 非异常范围内的最大值
        llim = Q1 - 1.5 * IQR  # 下限 非异常范围内的最小值

        new_deg = []
        uplim = []
        for i in range(len(deg)):
            if (llim < deg[i] and deg[i] < ulim):
                new_deg.append(deg[i])
        # print("清洗后数据共", len(new_deg), "个\n", new_deg)
    new_deg = np.mean(new_deg)

    return new_deg
    # 图表表达


flag = 0
p0 = 0


def markzero(path):
    img = cv2.imread(path)
    def on_EVENT_LBUTTONDOWN(event, x, y, flags, param):
        global flag, p0
        if event == cv2.EVENT_LBUTTONDOWN:
            xy = "%d,%d" % (x, y)
            p0 = [x, y]
            print(x, y)
            cv2.circle(img, (x, y), 2, (0, 0, 255), thickness=-1)
            cv2.putText(img, '*0*', (x - 30, y), 1,
                        2.0, (0, 0, 0), thickness=2)
            # cv2.imshow("image", img)

        elif event == cv2.EVENT_LBUTTONUP:  # 鼠标左键fang
            cv2.destroyWindow("image")
            print(p0)

    cv2.namedWindow("image")
    cv2.setMouseCallback("image", on_EVENT_LBUTTONDOWN)

    cv2.imshow('image', img)
    cv2.waitKey(10000)
    return p0
    # while (1):
    #     cv2.imshow("image", img)
    #     if cv2.waitKey(0)&0xFF>0:
    #     # if cv2.waitKey(500)|0xFF>0:
    #         print(flag)
    #         break


def cut_pic(path):
    """
    :param pyrMeanShiftFiltering(input, 10, 100) 均值滤波
    :param 霍夫概率圆检测
    :param mask操作提取圆
    :return: 半径,圆心位置

    """
    input = cv2.imread(path)
    dst = cv2.pyrMeanShiftFiltering(input, 10, 100)

    cimage = cv2.cvtColor(dst, cv2.COLOR_BGR2GRAY)

    circles = cv2.HoughCircles(cimage, cv2.HOUGH_GRADIENT, 1, 80, param1=100, param2=20, minRadius=80, maxRadius=0)
    circles = np.uint16(np.around(circles))  # 把类型换成整数
    r_1 = circles[0, 0, 2]
    c_x = circles[0, 0, 0]
    c_y = circles[0, 0, 1]
    # print(input.shape[:2])
    circle = np.ones(input.shape, dtype="uint8")
    circle = circle * 255
    cv2.circle(circle, (c_x, c_y), int(r_1), 0, -1)
    # cv2.circle(circle, (c_x, c_y), int(r_1*0.65), (255,255,255), -1)
    # cv2.imshow("circle", circle)
    bitwiseOr = cv2.bitwise_or(input, circle)

    # cv2.circle(bitwiseOr, (c_x, c_y), 2, 0, -1)
    # cv2.imshow(pname+'_resize'+ptype, bitwiseOr)
    cv2.imwrite(pname + '_resize' + ptype, bitwiseOr)
    ninfo = [r_1, c_x, c_y]
    return ninfo


def linecontours(cp_info):
    """
    :funtion : 提取刻度线,指针
    :param a: 高斯滤波 GaussianBlur,自适应二值化adaptiveThreshold,闭运算
    :param b: 轮廓寻找 findContours,
    :return:kb,new_needleset
    """
    r_1, c_x, c_y = cp_info
    img = cv2.imread(pname + '_resize' + ptype)

    cv2.circle(img, (c_x, c_y), 20, (23, 28, 28), -1)
    img = cv2.GaussianBlur(img, (3, 3), 0)
    gray = cv2.cvtColor(img, cv2.COLOR_BGR2GRAY)
    # cv2.imshow('dds', img)
    # ret, binary = cv2.threshold(~gray, 0, 255, cv2.THRESH_BINARY | cv2.THRESH_OTSU)
    binary = cv2.adaptiveThreshold(~gray, 255,
                                   cv2.ADAPTIVE_THRESH_GAUSSIAN_C, cv2.THRESH_BINARY, 15, -10)
    # cv2.circle(binary, (c_x, c_y), int(r_1*0.5), (0, 0, 0),5)
    # 闭运算
    # kernel = np.ones((3, 3), np.uint8)
    # dilation = cv2.dilate(binary, kernel, iterations=1)
    # kernel2 = np.ones((3, 3), np.uint8)
    # erosion = cv2.erode(dilation, kernel2, iterations=1)

    # ************************
    # cv2.imshow('dds', binary)

    aa, contours, hier = cv2.findContours(binary, cv2.RETR_LIST, cv2.CHAIN_APPROX_SIMPLE)

    cntset = []  # 刻度线轮廓集合
    cntareas = []  # 刻度线面积集合
    needlecnt = []  # 指针轮廓集合
    needleareas = []  # 指针面积集合
    ca = (c_x, c_y)
    incircle = [r_1 * 0.7, r_1 * 0.9]

    # incircle = [r_1 * 0.1, r_1 * 1]
    # cv2.drawContours(img, contours, -1, (255, 90, 60), 2)
    localtion = []
    for xx in contours:
        rect = cv2.minAreaRect(xx)
        # print(rect)
        a, b, c = rect
        w, h = b
        w = int(w)
        h = int(h)
        ''' 满足条件:“长宽比例”,“面积”'''
        if h == 0 or w == 0:
            pass
        else:
            dis = mential.ds_ofpoint(self=0, a=ca, b=a)

            if (incircle[0] < dis and incircle[1] > dis):
                localtion.append(dis)
                if h / w > 4 or w / h > 4:
                    cntset.append(xx)
                    cntareas.append(w * h)
            else:
                if w > r_1 / 2 or h > r_1 / 2:
                    needlecnt.append(xx)
                    needleareas.append(w * h)
    cntareas = np.array(cntareas)
    nss = remove_diff(cntareas)  # 中位数,上限区
    new_cntset = []
    # 面积
    for i, xx in enumerate(cntset):
        if (cntareas[i] <= nss * 1.5 and cntareas[i] >= nss * 0.8):
            new_cntset.append(xx)
    kb = []  # 拟合线集合
    for xx in new_cntset:
        rect = cv2.minAreaRect(xx)
        box = cv2.boxPoints(rect)
        box = np.int0(box)
        cv2.polylines(img, [box], True, (0, 255, 0), 1)  # pic
        output = cv2.fitLine(xx, 2, 0, 0.001, 0.001)
        k = output[1] / output[0]
        k = round(k[0], 2)
        b = output[3] - k * output[2]
        b = round(b[0], 2)
        x1 = 1
        x2 = gray.shape[0]
        y1 = int(k * x1 + b)
        y2 = int(k * x2 + b)
        cv2.line(img, (x1, y1), (x2, y2), (0, 255, 0), 1)
        kb.append([k, b])  # 求中心点的点集[k,b]

    ############################################################
    r = np.mean(localtion)
    mask = np.zeros(img.shape[0:2], np.uint8)
    # for cnt in needlecnt:
    #     cv2.fillConvexPoly(mask,cnt , 255)
    mask = cv2.drawContours(mask, needlecnt, -1, (255, 255, 255), -1)  # 生成掩膜
    # cv2.imshow('da', mask)

    cv2.imwrite(pname + '_scale' + ptype, img)
    cv2.imwrite(pname + '_needle' + ptype, mask)
    return kb, r, mask


def needle(img, r, cx, cy,x0,y0):
    oimg = cv2.imread(pname + ptype)
    # circle = np.ones(img.shape, dtype="uint8")
    # circle = circle * 255
    circle = np.zeros(img.shape, dtype="uint8")
    cv2.circle(circle, (cx, cy), int(r), 255, -1)
    mask = cv2.bitwise_and(img, circle)
    # cv2.imshow('m', mask)

    kernel = np.ones((3, 3), np.uint8)
    mask = cv2.dilate(mask, kernel, iterations=1)
    # erosion = cv2.erode(mask, kernel, iterations=1)
    # cv2.imshow('1big', mask)

    lines = cv2.HoughLinesP(mask, 1, np.pi / 180, 100, minLineLength=int(r / 2), maxLineGap=2)
    nmask = np.zeros(img.shape, np.uint8)
    # lines = mential.findline(self=0, cp=[x, y], lines=lines)
    # print('lens', len(lines))
    for line in lines:
        x1, y1, x2, y2 = line[0]
        cv2.line(nmask, (x1, y1), (x2, y2), 100, 1, cv2.LINE_AA)

    x1, y1, x2, y2 = lines[0][0]
    d1 = (x1 - cx) ** 2 + (y1 - cy) ** 2
    d2 = (x2 - cx) ** 2 + (y2 - cy) ** 2
    if d1 > d2:
        axit = [x1, y1]
    else:
        axit = [x2, y2]
    nmask = cv2.erode(nmask, kernel, iterations=1)

    # cv2.imshow('2new', nmask)
    aa, cnts, hier = cv2.findContours(nmask, cv2.RETR_LIST, cv2.CHAIN_APPROX_SIMPLE)
    areass = [cv2.contourArea(x) for x in cnts]
    # print(len(areass))
    i = areass.index(max(areass))
    # print('contours[i]',contours[i])
    # cv2.drawContours(img, contours[i], -1, (10,20,250), 1)
    # cv2.imshow('need_next', img)
    cnt = cnts[i]
    output = cv2.fitLine(cnt, 2, 0, 0.001, 0.001)
    k = output[1] / output[0]
    k = round(k[0], 2)
    b = output[3] - k * output[2]
    b = round(b[0], 2)
    x1 = cx
    x2 = axit[0]
    y1 = int(k * x1 + b)
    y2 = int(k * x2 + b)
    cv2.line(oimg, (x1, y1), (x2, y2), (0, 23, 255), 1, cv2.LINE_AA)
    cv2.line(oimg, (x1, y1), (x0,y0), (0, 23, 255), 1, cv2.LINE_AA)
    cv2.circle(oimg, (x1,y1), 2, (0, 123, 255), -1)
    # cv2.imshow('msss', oimg)
    cv2.imwrite(pname +'_result'+ ptype,oimg)
    cv2.imwrite(pname + '_needleline' + ptype, nmask)
    return x1, y1, x2, y2,oimg


def findpoint(kb,path):
    img = cv2.imread(path)
    w, h, c = img.shape
    point_list = []
    if len(kb) > 2:
        # print(len(kb))
        random.shuffle(kb)
        lkb = int(len(kb) / 2)
        kb1 = kb[0:lkb]
        kb2 = kb[lkb:(2 * lkb)]
        # print('len', len(kb1), len(kb2))
        kb1sample = sample(kb1, int(len(kb1) / 2))
        kb2sample = sample(kb2, int(len(kb2) / 2))
    else:
        kb1sample = kb[0]
        kb2sample = kb[1]

    for i, wx in enumerate(kb1sample):
        # for wy in kb2:
        for wy in kb2sample:
            k1, b1 = wx
            k2, b2 = wy
            # print('kkkbbbb',k1[0],b1[0],k2[0],b2[0])
            # k1-->[123]
            try:
                if (b2 - b1) == 0:
                    b2 = b2 - 0.1
                if (k1 - k2) == 0:
                    k1 = k1 - 0.1
                x = (b2 - b1) / (k1 - k2)
                y = k1 * x + b1
                x = int(round(x))
                y = int(round(y))
            except:
                x = (b2 - b1 - 0.01) / (k1 - k2 + 0.01)
                y = k1 * x + b1
                x = int(round(x))
                y = int(round(y))
            # x,y=solve_point(k1, b1, k2, b2)
            if x < 0 or y < 0 or x > w or y > h:
                break
            point_list.append([x, y])
            cv2.circle(img, (x, y), 2, (122, 22, 0), 2)
    # print('point_list',point_list)
    if len(kb) > 2:
        # cv2.imshow(pname+'_pointset',img)
        cv2.imwrite(pname + '_pointset' + ptype, img)
    return point_list


def countpoint(pointlist,path):
    # pointlist=[[1,2],[36,78],[36,77],[300,300],[300,300]]
    img = cv2.imread(path, 0)
    h, w = img.shape
    pic_list = np.zeros((h, w))
    for point in pointlist:
        # print('point',point)
        x, y = point
        if x < w and y < h:
            pic_list[y][x] += 1
    # print(pic_list)
    cc = np.where(pic_list == np.max(pic_list))
    # print(cc,len(cc))
    y, x = cc
    cc = (x[0], y[0])
    cv2.circle(img, cc, 2, (32, 3, 240), 3)
    # cv2.imshow(pname + '_center_point', img)
    cv2.imwrite(pname + '_center_point' + ptype, img)
    return cc


import datetime

pname, ptype=0,0
def decter(path,opoint):
    x0=opoint[0]
    y0=opoint[1]
    global  pname, ptype
    pname, ptype = path.split('.')
    ptype = '.' + ptype


    start = datetime.datetime.now()
    ninfo = cut_pic(path)  # 2.截取表盘
    kb, r, mask = linecontours(ninfo)
    point_list = findpoint(kb,path)
    cx, cy = countpoint(point_list,path)
    da, db, dc, de,oimg = needle(mask, r, cx, cy,x0, y0)
    # da,db,dc,de=needle_line(lines,new_needleset,cx,cy)
    # print(da,db,dc,de)
    distinguish = 100 / 360
    OZ = [da, db, x0, y0]
    OP = [da, db, dc, de]
    ang1 = angle(OZ, OP)
    output=ang1 * distinguish
    print("AB和CD的夹角",output)
    # print()
    # output=str(output)
    end = datetime.datetime.now()
    print(end - start)
    cv2.waitKey(1)
    # cv2.destroyAllWindows()
    return output,oimg

opint=markzero('5.jpg')
ang1 = decter('5.jpg',opint)
# print(ang1)

