Doing Math with Python读书笔记-第3章:Describing Data with Statistics
寻找平均值
统计学中的mean,就是数学中的average。
>>> a = list(range(1, 11))
>>> a
[1, 2, 3, 4, 5, 6, 7, 8, 9, 10]
>>> sum(a)
55
>>> len(a)
10
>>> avg = sum(a)/len(a)
>>> avg
5.5
寻找中位数
median就是统计学中的中位数。
中位数是指序列中一半的数大于它,一半的数小于它。
先将序列中元素排序,如果序列中元素的个数是奇数,则中位数就是中间那个数;如果为偶数,则中位数是中间两个数的平均值。
例如对于序列1到10,中位数就是(5+6)/2,等于5.5,恰好与平均值相等。序列中有一半的数大于它,一半的数小于它。
以下程序演示了平均值和中位值是不同的:
import random
n = 10
num = []
for i in range(n):
    num.append(random.randint(1, 100))

num.sort()

mean = sum(num)/len(num)

idx = int(n/2)
if n % 2 != 0:
    median = num[idx]
else:
    median = (num[idx] + num[idx - 1])/2

print(f'List is: {num}')
print(f'mean is {mean}, median is {median}')
运行:
List is: [5, 7, 15, 17, 20, 32, 32, 36, 38, 53]
mean is 25.5, median is 26.0

List is: [6, 9, 17, 23, 27, 40, 42, 51, 55, 91]
mean is 36.1, median is 33.5

List is: [2, 21, 25, 35, 36, 47, 48, 58, 59, 60]
mean is 39.1, median is 41.5
寻找众数并创建频度表
mode在统计学中称为众数或最频数,是一组数据中出现频次最高的数。
众数可能不止一个。
collections模块中的Counter类可计算众数。
>>> from collections import Counter
>>> a = [1, 2, 2, 3]
>>> c = Counter(a)
>>> c.most_common()		# 按出现频度排序
[(2, 2), (1, 1), (3, 1)]
>>> c.most_common(1)	# 返回出现频度最高的数,1表示前1位的
[(2, 2)]
>>> c.most_common(2)	# 返回出现频度最高的前两位数
[(2, 2), (1, 1)]
>>> c.most_common()[0][0]	# 返回众数
2
寻找众数
由于众数可能有多个,因此需要将most_common()返回第一个元素(tuple)中的频度(这个就是众数出现的频度)记录下来,然后比较余下元素的频度,直到频度小于这个值为止。
创建频度表
例如成绩单,按照分数从低到高出现的频度显示。代码如下:
from collections import Counter

scores = [98, 85, 82, 99, 85, 82, 85, 92, 90, 100, 83, 94, 100, 86, 98, 96, 91, 92, 80, 80]
c = Counter(scores).most_common()
c.sort()
for i in range(len(c)):
    print(f'{c[i][0]}:\t{c[i][1]}');
输出如下:
80:	2
82:	2
83:	1
85:	3
86:	1
90:	1
91:	1
92:	2
94:	1
96:	1
98:	2
99:	1
100:	2
计算离散度
dispersion是指集合中元素与平均值的偏离程度。涉及范围,方差,标准差3个概念。
范围
范围(range)是指集合中最大值和最小值之间的差。
>>> scores = [98, 85, 82, 99, 85, 82, 85, 92, 90, 100, 83, 94, 100, 86, 98, 96, 91, 92, 80, 80]
>>> max(scores)
100
>>> min(scores)
80
>>> range = max(scores) - min(scores)
>>> range
20
方差和标准差
方差(Variance)和标准差(Standard Deviation)。
方差的计算公式:
方 差 = ∑ ( x i − x m e a n ) 2 n 方差=\frac{\sum(x_{i} - x_{mean})^2}{n} 方差=n∑(xi−xmean)2
标 准 差 = 方 差 标准差 = \sqrt{方差} 标准差=方差
常用的是标准差而非方差,因标准差更直观,其也是与集合中的数一个级别。
相同平均值的一组数,其标准差可能差异很大。
计算两个数据集合间的相关性
Pearson correlation coefficient以下简称相关系数,衡量的是线性相关性。
相关系数在[-1, 1]之间,分为正相关和负相关。
correlation doesn’t imply causation意味相关性不代表因果关系。一个典型的例子是冰淇淋的销售上升伴随犯罪率的提高,这两者都和天气变热有关系。即使如此,天气变热和犯罪率上升也非因果关系。
计算相关系数
c o r r e l a t i o n = n ∑ x y − ∑ x ∑ y ( n ∑ x 2 − ( ∑ x ) 2 ) ( n ∑ y 2 − ( ∑ y ) 2 ) correlation=\frac{n\sum{xy} - \sum{x}\sum{y}}{\sqrt{(n\sum{x^2}-(\sum{x})^2)(n\sum{y^2}-(\sum{y})^2)}} correlation=(n∑x2−(∑x)2)(n∑y2−(∑y)2)n∑xy−∑x∑y
实现要点为zip(),zip将两个list中的对应元素组合成tuple,返回list of tuple,这样方便实现 ∑ x y \sum{xy} ∑xy。
>>> x = [1, 2, 3]
>>> y = [4, 5, 6]
>>> list(zip(x, y))
[(1, 4), (2, 5), (3, 6)]
>>> for a,b in zip(x, y):
...     print(a,b)
...
1 4
2 5
3 6
高中成绩与大学入学考试成绩的关联性
在这个例子里,作者给了10个学生的3组数据集A,B,C。
A为高中多科平均成绩,B仅为数学的平均成绩,C为大学入学考试的成绩。
A = [89, 88, 86, 85, 91, 87, 90, 92, 93, 94] # random.shuffle(B)
B = [85, 86, 87, 88, 89, 90, 91, 92, 93, 94] # list(range(85, 95))
C = [90, 91, 92, 93, 94, 95, 96, 97, 98, 99] # list(range(90, 100))
计算相关性发现,A和C相关性低(0.73),B和C相关性高(1)。为简化,相关性是通过Excel公式计算的(=CORREL(A1:A10, C1:C10))。
通过B和C的散点图(scatter plot)发现,其关系接近于线性:

散点图
以上散点图的绘制如下:
A = [89, 88, 86, 85, 91, 87, 90, 92, 93, 94]
B = [85, 86, 87, 88, 89, 90, 91, 92, 93, 94]
C = [90, 91, 92, 93, 94, 95, 96, 97, 98, 99]
import matplotlib.pyplot as plt
plt.scatter(B, C)
plt.xlabel('high school math grades')
plt.ylabel('college admission test scores')
plt.show()
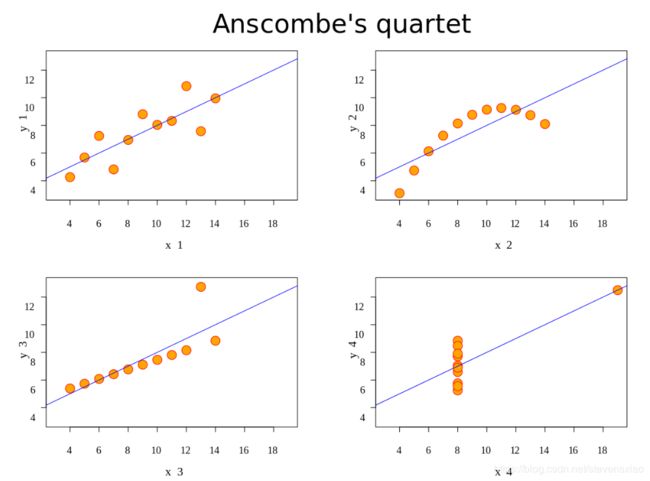
Anscombe’s quartet是统计学家Francis Anscombe发明的,他发现四个不同的数据集具有几乎相同的统计特性:平均值,方差和相关性。但是通过散点图,可以看出这些数据集之间差异很大。这也表明了数据可视化的重要性,下图来自Wikipedia:

从文件读取数据
从文本文件读取数据
$ cat data.txt
85
86
87
88
89
90
91
92
93
94
$ cat data.py
with open('data.txt') as f:
    total = 0
    for line in f:	# 读取每一行
       total += float(line)

print(f'SUM is {total}')
$ p3 data.py
SUM is 895.0
从CSV文件读取数据
CSV表示comma-separated value。CSV文件由header(可选)和数据组成。
$ cat data.py
import csv
with open('data.csv') as f:
    reader = csv.reader(f)
    next(reader)	# 如果没有header,则注释此行
    for line in reader:
        print(f'{line[0]} - {line[1]}')
$ p3 data.py
2 -   4
4 -   16
6 -   36
编程挑战
Google Trend
作者提供的链接已经无效。不过Google Trend上还是可以下载一些数据。
美国年度人口数据增长
数据集从Quandl下载,此网站还有很多开放数据集。
作者的实现有几点可以学习的地方。
第1点是如何翻转list,因为数据是按时间降序的,因此需要翻转。
翻转用reverse()即可,而作者用的是[::-1],实际这是一个切片,步进值为-1。
>>> a=[1, 3, 5, 7, 9, 2, 4, 6, 8, 10]
>>> a=a[::-1]
>>> a
[10, 8, 6, 4, 2, 9, 7, 5, 3, 1]
>>> a=[1, 3, 5, 7, 9, 2, 4, 6, 8, 10]
>>> a.reverse()
>>> a
[10, 8, 6, 4, 2, 9, 7, 5, 3, 1]
第2点是作者在文件stats.py中实现了方法mean(), median()和variance_sd()。然后在主程序中引入这几个方法:
from stats import mean, median, variance_sd
第3点是在方法variance_sd()中返回了两个值,即方差和标准差。
>>> def return_tow_value():
...     return 1, 2
...
>>> a, b = return_two_value()
>>> a
1
>>> b
2
>>> a, b
(1, 2)
>>> c = return_two_value()
>>> type(c)
<class 'tuple'>
第4点是打印格式化的方法(接上例),其中的*号称为starred expression。
starred expression可以用在函数调用中,表示将一个iterable拆开:
>>> print(f'{return_two_value()}')	# 我的写法
(1, 2)
>>> print('{0} - {1}'.format(*return_tow_value()))	# 作者的写法,注意*号
1 - 2
>>> print(*[1,2,3,4])
1 2 3 4
第5点是画图的方式,作者同时显示了两个图表。文档帮助见这里:
    plt.figure(1)	# 创建一个新的图表
    xaxis_positions = range(0, len(years))
    plt.plot(population, 'r-')	# 'r-'是格式,表示红色实线
	...
    plt.xticks(xaxis_positions, years, rotation=45)	# 横轴的刻度位置,文字和文字倾斜度

    plt.figure(2)
	...
	plt.show()	# 显示所有的figure
计算百分位
Percentile即百分位。假设某考生成绩处于95百分位,则代表95%学生的成绩都低于或等于此学生。
假设p为percentile,data是数据集,n为数据集的个数,先计算idx如下:
i d x = n p 100 + 0.5 idx = \frac{np}{100} + 0.5 idx=100np+0.5
如果idx是整数,data[idx]就是与百分位p对应的数字。
如果idx不是整数,则设k和f分别为idx的整数和小数部分,(1-f)*data[k] + f*data[k+1]就是与百分位p对应的数字。
实现如下:
import random

def calcPercentile(data, p):
    idx = (len(data) * p)/100 + 0.5

    if idx.is_integer():
        return data[int(idx) - 1]
    else:
        k = int(idx)
        f = idx - k
        return (1-f)*data[k-1] + f*data[k]

data = []
for i in range(10):
    data.append(random.randint(1, 100))

data.sort()
print(data)

response = ''
while True:
    response = input('Please input percentile(Q/q to quit):')
    if response.upper() == 'Q':
        break

    p = int(response)
    num = calcPercentile(data, p)
    print(f'Number {num} is the number correspond to Percentile {p}')
测试如下:
$ p3 percentile.py
[21, 23, 41, 41, 55, 57, 58, 59, 65, 73]
Please input percentile(Q/q to quit):25
Number 41 is the number correspond to Percentile 25
Please input percentile(Q/q to quit):50
Number 56.0 is the number correspond to Percentile 50
Please input percentile(Q/q to quit):75
Number 59 is the number correspond to Percentile 75
Please input percentile(Q/q to quit):q
有一个教训,就是不要漏掉方法的括号,已经错了两次了。例如idx.is_integer()不能写成idx.is_integer,这样意义就完全变了,更重要的是这样写不会报错!
另外给出一个测试数据集[5, 1, 9, 3, 14, 9, 7],25百分位对应的数值为2.5,50百分位的数值为7。