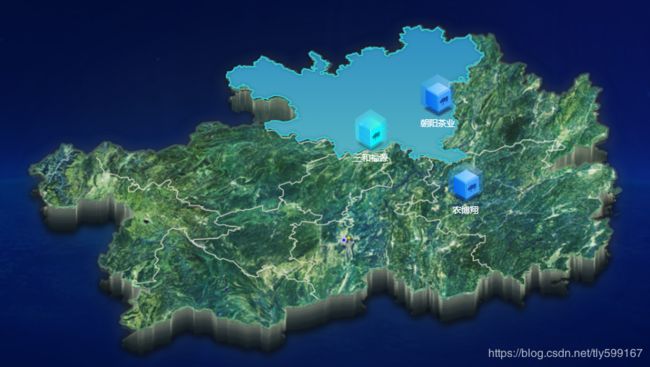
echarts自定义map背景,以及自定义标注效果
实现思路
- 设置DIV的背景图,为自定义彩图;
- 绘制echarts地图,默认情况下区域颜色透明,没有边框;
- 通过设置aspectScale(宽高比)、center(中心坐标)、zoom(缩放大小)来控制echarts和彩图的重叠效果;
- 设置鼠标浮动到的区域效果,渐变色、背景等等。
实现代码
js代码
const json = require('@/assets/data/guizhou.json')
echarts.registerMap('贵州省', json)
this.centerMapChart = echarts.init(document.getElementById('center-map'))
this.centerMapChart.setOption({
    geo: {
        type: 'map',
        map: '贵州省',
        aspectScale: 1.5,
        center: [106.602177096, 27.0449067414],
        zoom: 1,
        roam: false,
        label: {
            normal: {
                show: false
            },
            emphasis: {
                show: false,
                textStyle: {
                    color: '#fff',
                    fontSize: 10
                }
            }
        },
        itemStyle: {
            normal: {
                borderWidth: 0,
                areaColor: 'rgba(0, 0, 0, 0)'
            },
            emphasis: {
                borderColor: '#34C6D3',
                borderWidth: 2,
                shadowColor: 'rgba(0, 0, 0, 0.3)',
                shadowBlur: 5,
                areaColor: {
                    type: 'linear',
                    x: 0,
                    y: 0,
                    x2: 0,
                    y2: 1,
                    colorStops: [{
                        offset: 0, color: '#2C8CC1' // 0% 处的颜色
                    }, {
                        offset: 1, color: '#57B5C2' // 100% 处的颜色
                    }],
                }
            }
        }
    },
    series: {
        type: 'map',
        geoIndex: 0,
        markPoint: {
            silent: false,
            animation: 'BMAP_ANIMATION_BOUNCE',
            symbolSize: [50, 60],
            symbol: 'image://' + require('@/assets/imgs/info-no.png'),
            label: {
                show: true,
                position: 'bottom',
                distance: 3,
                color: '#fff',
                fontSize: 12,
                formatter: '{b}',
            },
            data: this.mapData.map(item => {
                const opt = {
                    name: item.orgName,
                    coord: item.position,
                    orgCode: item.orgCode
                }
                if (item.orgCode === this.loanEnterpriseInfo.orgCode) {
                    opt.symbol = 'image://' + require('@/assets/imgs/info-al.png')
                }
                return opt
            })
        }
    }
})
HTML代码
<div class="main-center-map" id="center-map">div>
CSS代码
.main-center-map{
    width: 78.5rem;
    height: 48.8rem;
    background-image:url('~@/assets/imgs/map.png');
    background-size:cover;
    position: absolute;
    left: 1rem;
    bottom: 0rem;
}