DONCHIAN'S TRADING GUIDES
Richard D. Donchian, a well-respected Wall Street technician who began his career in 1930, initially compiled these guides in 1934 after suffering losses in 1929. He later dug them up again while working for Hayden Stone (now Shearson Lehman Brothers) and reviewed them in the firm's July 3, 1974, "Trend Timing" commodity letter. In that publication, Donchian noted which points he felt remained the most important: General 1,2,3,4 and 5 and Technical 1, 4,5 and 9.
Donchian's General Guides
1 Beware of acting immediately on widespread public opinion. Even if it is correct, it will usually delay the move.
2 From a period of dullness and inactivity, watch for and prepare to follow a move in the direction in which volume increases.
3 Limit losses and ride profits, irrespective of all other rules.
4 Light commitments are advisable when a market position is not certain. Clearly defined moves are signaled frequently enough to make life interesting, and concentration on these moves to the virtual exclusion of others will prevent unprofitable whipsawing.
5 Seldom take a position in the direction of an immediately preceding three-day move. Wait for a one-day reversal.
6 Judicious use of stop orders is a valuable aid to profitable trading. Stops may be used to protect profits, limit losses and take positions from certain formations such as triangular foci. Stop orders are apt to be more valuable and less treacherous if used in proper relation to the chart formation.
7 In a market in which upswings are likely to equal or exceed downswings, a heavier position should be taken for the upswings for percentage reasons; a decline from 50 to 25 will net only 50% profit, whereas an advance from 25 to 50 will net 100%.
8 In taking a position, price orders are allowable. In closing a position, use "market" orders.
9 Buy strong-acting, strong-background commodities and sell weak ones subject to all other rules.
10 Moves in which rails lead or participate strongly are usually worth following more than moves in which rails lag.
11 A study of the capitalization of a company, the degree of activity of an issue and whether the issue is a lethargic truck horse like Consolidated Edison or a spirited, volatile race horse like Case Threshing Machine is fully as important as a study of statistical reports.
Donchian's Technical Guides
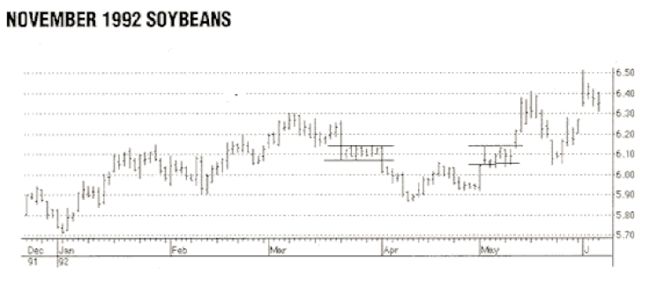
1 A move followed by a sideways range often precedes another move of almost equal extent in the same direction of the original move. Generally, when the second move from the sideways range has run its course, a countermove approaching the sideways range may be expected (Figure 1).
2 Reversal or resistance to a move is likely to be encountered on reaching levels at which the commodity has fluctuated for a considerable length of time within a narrow range in the past or on approaching previous highs or lows.
3 Watch for good buying or selling opportunities when trendlines are approached, especially on medium or dull volume. Be sure such a line has not been adhered to or hit too frequently.
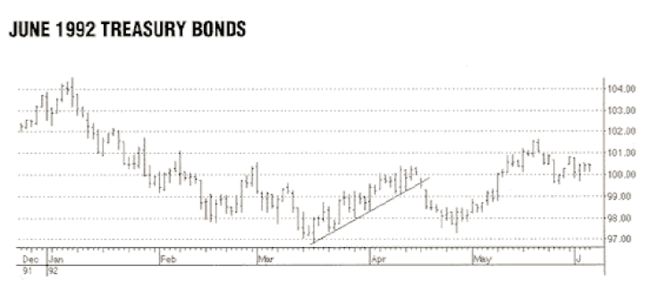
4 Watch for "crawling along" or repeated bumping of minor or major trendlines and prepare to see such trendlines broken (Figure 2).
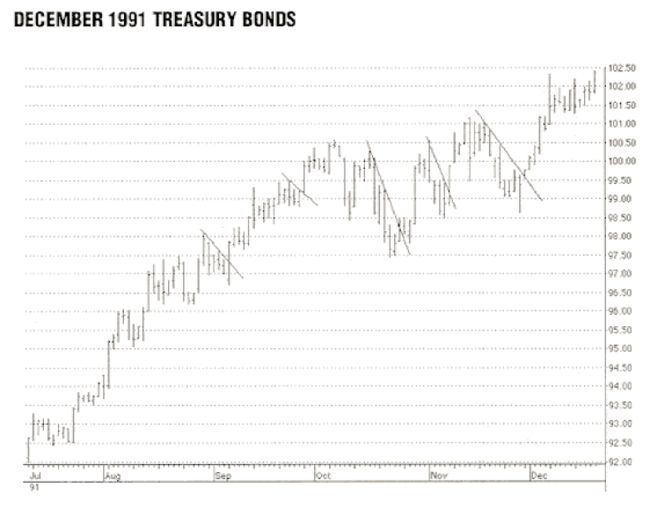
5 Breaking of minor trendlines counter to the major trend gives most other important position-taking signals. Positions can be taken or reversed on stops at such places (Figure 3).
6 Triangles of either slope may mean either accumulation or distribution depending on other considerations, although triangles are usually broken on the flat side.
7 Watch for volume climax, especially after a long move.
8 Don't count on gaps being closed unless you can distinguish among breakaway gaps, normal gaps and exhaustion gaps.
9 During a move, take or increase positions in the direction of the move at the market the morning following any one-day reversal, however slight the reversal may be, especially if volume declines on the reversal.
FIGURE 1: Sideways price action may be followed by a resumption of the prior trend. Prices may travel about the same distance as before the sideways trading range and then move back toward the trading range.
FIGURE 2: Trendlines are typically broken where the market is repeatedly touching them.
FIGURE 3: Draw minor trendlines along minor trends that are counter to the major trend In this example, the major upward trend resumed when the minor downtrend lines were broken.


