Charts一款绘制图表的框架:可以绘制多种类型的图表;通过手势进行两个轴的缩放和拖拽等等,只要记住支持全方位自定义就行了,开始正文
准备工作
使用Pod导入Charts:
platform :ios, '8.0'
use_frameworks!

def pods
    pod 'Charts', '~> 3.0'
end
target 'chartsDemo' do
    pods
end
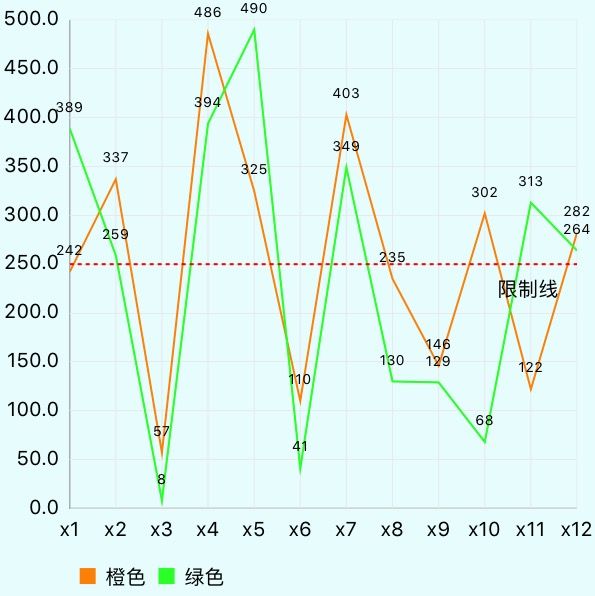
一、折线图LineChartView
时间问题只能先搞个折线图,写的比较粗糙将就看吧,后面还有个饼状图O(∩_∩)O~
初始化LineChartView
懒加载:取消双击缩放和拖拽 隐藏右边Y轴,设置左边Y轴...
lazy var lineChartView:LineChartView = {
        let _lineChartView = LineChartView.init(frame: CGRect.init(x: 0, y: 20, width: 300, height: 300));
        _lineChartView.delegate = self;//
        _lineChartView.backgroundColor = UIColor.init(red: 230/255.0, green: 253/255.0, blue: 253/255.0, alpha: 1.0);
        _lineChartView.doubleTapToZoomEnabled = false;
        _lineChartView.scaleXEnabled = false;
        _lineChartView.scaleYEnabled = false;
        _lineChartView.chartDescription?.text = "";//设置为""隐藏描述文字

        _lineChartView.noDataText = "暂无数据";
        _lineChartView.noDataTextColor = UIColor.gray;
        _lineChartView.noDataFont = UIFont.boldSystemFont(ofSize: 14);

        //y轴
        _lineChartView.rightAxis.enabled = false;
        let leftAxis = _lineChartView.leftAxis;
        leftAxis.labelCount = 10;
        leftAxis.forceLabelsEnabled = false;
        leftAxis.axisLineColor = UIColor.black;
        leftAxis.labelTextColor = UIColor.black;
        leftAxis.labelFont = UIFont.systemFont(ofSize: 10);
        leftAxis.labelPosition = .outsideChart;
        leftAxis.gridColor = UIColor.init(red: 233/255.0, green: 233/255.0, blue: 233/255.0, alpha: 1.0);//网格
        leftAxis.gridAntialiasEnabled = false;//抗锯齿
        leftAxis.axisMaximum = 500;//最大值
        leftAxis.axisMinimum = 0;
        leftAxis.labelCount = 11;//多少等分

        //x轴
        let xAxis = _lineChartView.xAxis;
        xAxis.granularityEnabled = true;
        xAxis.labelTextColor = UIColor.black;
        xAxis.labelFont = UIFont.systemFont(ofSize: 10.0);
        xAxis.labelPosition = .bottom;
        xAxis.gridColor = UIColor.init(red: 233/255.0, green: 233/255.0, blue: 233/255.0, alpha: 1.0);
        xAxis.axisLineColor = UIColor.black;
        xAxis.labelCount = 12;
        return _lineChartView;
    }()
填充数据
func drawLineChart(){
        self.addLimitLine(250, "限制线");
        let xValues = ["x1","x2","x3","x4","x5","x6","x7","x8","x9","x10","x11","x12"];
        lineChartView.xAxis.valueFormatter = VDChartAxisValueFormatter.init(xValues as NSArray);
        lineChartView.leftAxis.valueFormatter = VDChartAxisValueFormatter.init();

        var yDataArray1 = [ChartDataEntry]();
        for i in 0...xValues.count-1 {
            let y = arc4random()%500;
            let entry = ChartDataEntry.init(x: Double(i), y: Double(y));

            yDataArray1.append(entry);
        }
        let set1 = LineChartDataSet.init(values: yDataArray1, label: "橙色");
        set1.colors = [UIColor.orange];
        set1.drawCirclesEnabled = false;//绘制转折点
        set1.lineWidth = 1.0;

        var yDataArray2 = [ChartDataEntry]();
        for i in 0...xValues.count-1 {
            let y = arc4random()%500+1;
            let entry = ChartDataEntry.init(x: Double(i), y: Double(y));

            yDataArray2.append(entry);
        }
        let set2 = LineChartDataSet.init(values: yDataArray2, label: "绿色");
        set2.colors = [UIColor.green];
        set2.drawCirclesEnabled = false;
        set2.lineWidth = 1.0;

        let data = LineChartData.init(dataSets: [set1,set2]);

        lineChartView.data = data;
        lineChartView.animate(xAxisDuration: 1.0, yAxisDuration: 1.0, easingOption: .easeInBack);
    }
valueFormatter设置说明
自定义formatter继承协议ChartViewDelegate
import UIKit
import Charts
class VDChartAxisValueFormatter: NSObject,IAxisValueFormatter {
    var values:NSArray?;
    override init() {
        super.init();
    }
    init(_ values: NSArray) {
        super.init();
        self.values = values;
    }
    func stringForValue(_ value: Double, axis: AxisBase?) -> String {
        if values == nil {
            return "\(value)";
        }
        return values?.object(at: Int(value)) as! String;
    }
}
其它设置说明
设置限制线
func addLimitLine(_ value:Double, _ desc:String) {
        let limitLine = ChartLimitLine.init(limit: value, label: desc);
        //线
        limitLine.lineWidth = 1;
        limitLine.lineColor = UIColor.red;
        limitLine.lineDashLengths = [2.0,2.0];
        //文字
        limitLine.valueFont = UIFont.systemFont(ofSize: 10.0);
        limitLine.valueTextColor = UIColor.black;
        limitLine.labelPosition = .rightBottom;
        lineChartView.leftAxis.addLimitLine(limitLine);
    }
设置MarkerView:点击拐点显示基本信息
自定义MarkerView
func showMarkerView(_ value: String) {
        let marker = MarkerView.init(frame: CGRect.init(x: 20, y: 20, width: 60, height: 20));
        marker.chartView = lineChartView;
        let label = UILabel.init(frame: CGRect.init(x: 0, y: 0, width: 60, height: 20));
        label.text = value;
        label.textColor = UIColor.white;
        label.font = UIFont.systemFont(ofSize: 12);
        label.backgroundColor = UIColor.gray;
        label.textAlignment = .center;
        marker.addSubview(label);
        lineChartView.marker = marker;

    }
实现代理方法chartValueSelected(_ chartView: ChartViewBase, entry: ChartDataEntry, highlight: Highlight),显示marker
func chartValueSelected(_ chartView: ChartViewBase, entry: ChartDataEntry, highlight: Highlight) {
        self.showMarkerView("\(entry.y)");
    }
二、饼状图PieChartView
可能是颜色搭配问题画的图不好看,不过主要还是实现 let's go!
初始化PieChartView
懒加载:都是一些基本设置注释很详细自己看喽,主要设置自动转百分比(百分号需要自己加,后面会有说明)、空心设置和图例显示设置
lazy var pieChartView: PieChartView = {
        let _pieChartView = PieChartView.init(frame: CGRect.init(x: 0, y: 20, width: 340, height: 340));
        _pieChartView.backgroundColor = UIColor.init(red: 230/255.0, green: 253/255.0, blue: 253/255.0, alpha: 1.0);
        _pieChartView.setExtraOffsets(left: 40, top: 10, right: 40, bottom: 30);//设置这块饼的位置
        _pieChartView.chartDescription?.text = "饼状图示例";//描述文字
        _pieChartView.chartDescription?.font = UIFont.systemFont(ofSize: 12.0);//字体
        _pieChartView.chartDescription?.textColor = UIColor.black;//颜色

        _pieChartView.usePercentValuesEnabled = true;//转化为百分比
        _pieChartView.dragDecelerationEnabled = false;//我把拖拽效果关了
        _pieChartView.drawEntryLabelsEnabled = true;//显示区块文本
        _pieChartView.entryLabelFont = UIFont.systemFont(ofSize: 10);//区块文本的字体
        _pieChartView.entryLabelColor = UIColor.white;
        _pieChartView.drawSlicesUnderHoleEnabled = true;


        _pieChartView.drawHoleEnabled = true;//这个饼是空心的
        _pieChartView.holeRadiusPercent = 0.382//空心半径黄金比例
        _pieChartView.holeColor = UIColor.white;//空心颜色设置为白色
        _pieChartView.transparentCircleRadiusPercent = 0.5;//半透明空心半径

        _pieChartView.drawCenterTextEnabled = true;//显示中心文本
        _pieChartView.centerText = "饼状图";//设置中心文本,你也可以设置富文本`centerAttributedText`

        //图例样式设置
        _pieChartView.legend.maxSizePercent = 1;//图例的占比
        _pieChartView.legend.form = .circle//图示:原、方、线
        _pieChartView.legend.formSize = 8;//图示大小
        _pieChartView.legend.formToTextSpace = 4;//文本间隔
        _pieChartView.legend.font = UIFont.systemFont(ofSize: 8);
        _pieChartView.legend.textColor = UIColor.gray;
        _pieChartView.legend.horizontalAlignment = .left;
        _pieChartView.legend.verticalAlignment = .top;

        _pieChartView.animate(xAxisDuration: 1.0, yAxisDuration: 1.0, easingOption: .easeInBack);

        return _pieChartView;
    }()
填充数据开始画饼
单独讲
- 需要两组数据:标题或者描述 和 数据
- 设置指示折线时记住将标题和数据位置分离(注释有写的)
- 代码
data.setValueFormatter(VDChartAxisValueFormatter.init())中的VDChartAxisValueFormatter需要继承代理IValueFormatter然后实现代理方法
func stringForValue(_ value: Double, entry: ChartDataEntry, dataSetIndex: Int, viewPortHandler: ViewPortHandler?) -> String {
        return String.init(format: "%.2f%%", value);
    }
开画
func drawPieChartView() {
        let titles = ["红","黄","蓝色","橙","绿"];
        let yData = [20,30,10,40,60];
        var yVals = [PieChartDataEntry]();
        for i in 0...titles.count-1 {
            let entry = PieChartDataEntry.init(value: Double(yData[i]), label: titles[i]);
            yVals.append(entry);
        }

        let dataSet = PieChartDataSet.init(values: yVals, label: "");
        dataSet.colors = [UIColor.red,UIColor.yellow,UIColor.blue,UIColor.orange,UIColor.green];
        //设置名称和数据的位置 都在内就没有折线了哦
        dataSet.xValuePosition = .insideSlice;
        dataSet.yValuePosition = .outsideSlice;
        dataSet.sliceSpace = 1;//相邻块的距离
        dataSet.selectionShift = 6.66;//选中放大半径
        //指示折线样式
        dataSet.valueLinePart1OffsetPercentage = 0.8 //折线中第一段起始位置相对于区块的偏移量, 数值越大, 折线距离区块越远
        dataSet.valueLinePart1Length = 0.8 //折线中第一段长度占比
        dataSet.valueLinePart2Length = 0.4 //折线中第二段长度最大占比
        dataSet.valueLineWidth = 1 //折线的粗细
        dataSet.valueLineColor = UIColor.brown //折线颜色

        let data = PieChartData.init(dataSets: [dataSet]);
        data.setValueFormatter(VDChartAxisValueFormatter.init());//格式化值(添加个%)
        data.setValueFont(UIFont.systemFont(ofSize: 10.0));
        data.setValueTextColor(UIColor.lightGray);
        pieChartView.data = data;

    }
本人比较懒喜欢直接上代码,当一个快速笔记看吧,有问题欢迎指出

