《机器学习实战》Python3实现代码(第三章节)
本文是针对《机器学习实战》(第三章)内所需要的程序代码进行修改(书中使用的是py2),现已py3呈现。
程序清单3-1:
from math import log

def createDataSet():
    dataSet = [[1,1,'maybe'],
               [1,1,'yes'],
               [1,0,'no'],
               [0,1,'no'],
               [0,1,'no']
                ]
    labels = ['no surfacing','flippers']
    return dataSet,labels

def clacShannonEnt(dataSet):
    numEntries = len(dataSet)
    labelCounts = {}
    for featVec in dataSet:
        currentLabel = featVec[-1]
        if currentLabel not in labelCounts.keys():
            labelCounts[currentLabel] = 0
        labelCounts[currentLabel] += 1
    shannonEnt = 0.0
    for key in labelCounts:
        prob = float(labelCounts[key])/numEntries
        shannonEnt -= prob * log(prob,2)
    return shannonEnt

if __name__== '__main__':
    dataSet,label = createDataSet()

    print(clacShannonEnt(dataSet))


运行结果:1.3709505944546687
程序清单3-2:
def splitDataSet(dataSet,axis,value):
    #create a new list,ban from change the data of testData
    retDataSet = []
    for featVec in dataSet:
    #function:
    #find the data in the dataSet and accord with the value which need to return
        if featVec[axis] == value:
            reducedFeatVec = featVec[:axis]
            reducedFeatVec.extend(featVec[axis+1:])
            retDataSet.append(reducedFeatVec)
    return retDataSet

运行结果:[[1, 'maybe'], [1, 'yes'], [0, 'no']]
程序清单3-3:
def chooseBestFeatureToSplit(dataSet):
    numFeatures = len(dataSet[0])-1
    baseEntropy = clacShannonEnt(dataSet)
    bestInfoGain = 0.0
    bestFeature = -1
    for i in range (numFeatures):
        featList = [example[i] for example in dataSet]
        uniqueVals = set(featList)
        newEntropy = 0.0
        for value in uniqueVals:
            subDataSet = splitDataSet(dataSet,i,value)
            prob = len(subDataSet)/float(len(dataSet))
            newEntropy += prob * clacShannonEnt(subDataSet)
        infoGain = baseEntropy - newEntropy
        if(infoGain > bestFeature):
            bestInfoGain = infoGain
            bestFeature = i
    return bestFeature
程序清单3-4:
def createTree(dataSet,labels):
    classList = [example[-1] for example in dataSet]
    if classList.count(classList[0]) == len(classList):
        return classList[0]
    if len(dataSet[0])==1:
        return majorityCnt(classList)
    bestFeat = chooseBestFeatureToSplit(dataSet)
    bestFeatLabel = labels[bestFeat]
    myTree = {bestFeatLabel:{}}
    del(label[bestFeat])
    featValues = [example[bestFeat] for example in dataSet]
    uniquevVals = set(featValues)
    for value in uniquevVals:
        subLabels = labels[:]
        myTree[bestFeatLabel][value] = createTree(splitDataSet(dataSet,bestFeat,value),subLabels)
    return myTree

def majorityCnt(classList):
    #存储classList中每个标签出现的频率
    classCount = {}
    for vote in classList:
        if vote not in classCount.keys():
            classCount[vote] = 0
        classCount [vote] += 1
    sortedClassCount = sorted(classCount.items(),key=operator.itemgetter(1),reverse = True)
    return sortedClassCount[0][0]

运行结果:{'flippers': {0: 'no', 1: {'no surfacing': {0: 'no', 1: 'yes'}}}}
程序清单3-5:
import matplotlib.pyplot as plt
#定义文本框呵箭头格式
decisionNode = dict(boxstyle='sawtooth',fc='0.8')
leafNode = dict(boxstyle='round4',fc='0.8')
arrow_args = dict(arrowstyle='<-')

def plotNode(nodeTxt,centerPt,parentPt,nodeType):
    #绘制箭头的注解
    createPlot.ax1.annotate(nodeTxt,xy=parentPt,xycoords='axes fraction',\
            xytext=centerPt,textcoords='axes fraction',va='center',ha='center',\
            bbox=nodeType,arrowprops=arrow_args)

def createPlot():
    fig = plt.figure(1,facecolor='white')
    fig.clf()
    createPlot.ax1 = plt.subplot(111,frameon = False)
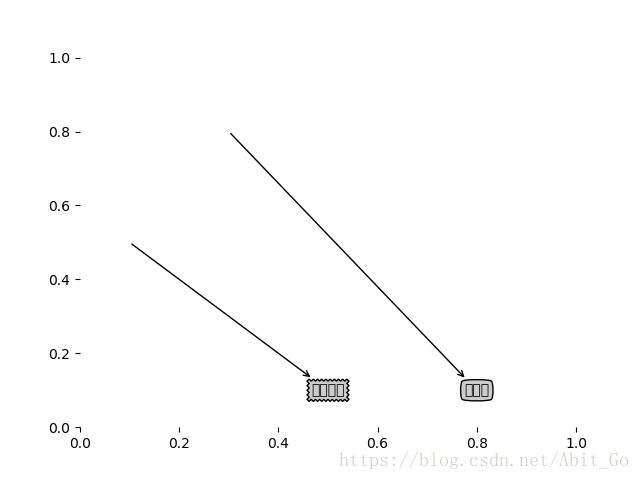
    plotNode('决策节点',(0.5,0.1),(0.1,0.5),decisionNode)
    plotNode('叶节点',(0.8,0.1),(0.3,0.8),leafNode)
    plt.show()

createPlot()后面的代码不做描述,原因为不是核心机器学习代码。
