自己把自己坑了
公司需求的时候,做了一种线形图,根据数值的大小,变换颜色。示例图如下:
线形图的写法:
color:function(params) {
    let colorList = ['#2CBAFF','#FE7979'];
    if (params.data < 70) {
        return colorList[0];
    } else if (params.data >= 70) {
        return colorList[1];
    }
}
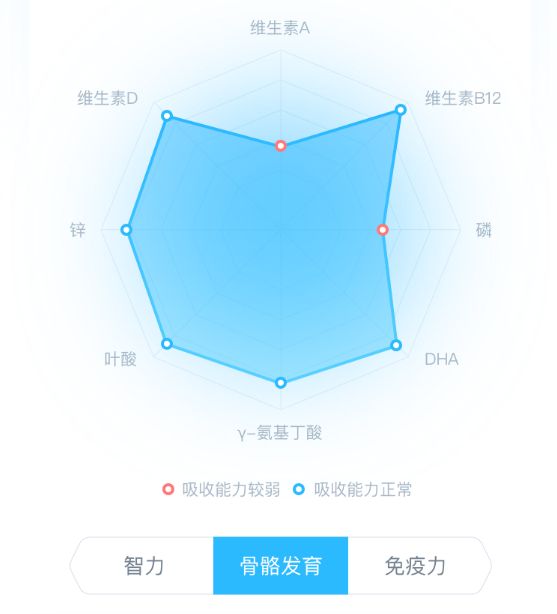
产品经理问我,可以不可以做出这样的。设计图如下:
因为才使用这个插件一天,也不是很熟悉,感觉原理应该差不多。就答应了下来。
(自己挖坑 = =! )
等真正做的时候,发现事情并没有这么简单。。
-
首先,线图和雷达图的数据写法不一样
线图的数据如下:
series : [
  {
    type:'line',   --类型 线
    label: {
        normal: {   --文字样式
            margin:2,         --距离
            show: true,       --是否展示文字
            position: 'top',  --文字在点的哪个位置
            fontSize:'14'     --文字大小
        }
    },


    -----------------------------数据在这---------------------------------
    data:[86, 78, 65, 52, 51, 49],
    -----------------------------数据在这---------------------------------


    smooth: true,  --让曲线变平滑的
    symbolSize: 13,  --圆点大小
    color:function(params) {   -- 颜色  颜色写在外面,就是圆点和文字同种颜色
      let colorList = ['#2CBAFF','#FE7979'];
      alert(params.data)    画重点!!! 循环输出 数据   86   78  65  52  51  49
      if (params.data < 70) {    /
          return colorList[0];
      } else if (params.data >= 70) {
          return colorList[1];
      }
    },
    lineStyle: {   -- 线的样式
      normal: {
        color: '#2CBAFF',
        width: 6,
        shadowColor: 'rgba(0,70,139,0.9)',
        shadowBlur: 50,
        shadowOffsetY: 15
      }
    },
    itemStyle:{  -- 圆点样式
      borderWidth:3
    },
  }
]
线图的数据: data:[xxx,xxx,xxx,xxx,xxx,xxx,xxx]
雷达图数据如下:
series: [
  {
    type: 'radar',
    radarIndex: 1,
    data: [
        {


            -----------------------------数据在这---------------------------------
            value: [100, 60, 50, 80, 50, 90, 80, 50, 80, 40],  -- 数据
            -----------------------------数据在这---------------------------------


            symbolSize: 8,  --拐点大小
            lineStyle: {   --线的样式
                width: 4,
                color: '#29B8FF'
        },
        areaStyle: {    --数据圈内样式
            normal: {
                opacity: 0.9,
                color: new echarts.graphic.RadialGradient(0.5, 0.5, 1, [
                    {
                        color: '#27B7FF',
                        offset: 0
                    },
                    {
                        color: '#5AD1FF',
                        offset: .4
                    }
                ])
            }
        }
    }
  ],
  itemStyle: {  --圆点样式
      normal: {
        borderWidth: 0,
        //color: '#2CBAFF',
        color:function(params) {   -- 颜色  颜色写在外面,就是圆点和文字同种颜色
           let colorList = ['#2CBAFF','#FE7979'];
               alert(params.data)    不同点 获取不到数据
           if (params.data < 70) {    /
              return colorList[0];
           }else if (params.data >= 70) {
              return colorList[1];
        }
      }
    }
  },
 }
雷达图的数据: data:[ value{xxx,xxx,xxx,xxx,xxx,xxx,xxx} ]  内
后来的做法:把itemStyle提了出去,与data同级
series: [
  {
    type: 'radar',
    radarIndex: 1,
    data: [
       { value: [75, 95, 90, 90, 85, 83, 80, 60, 90, 100],
         symbolSize: 7,
         // itemStyle: {
         //     normal: {
         //         borderWidth: 2,
         //         // color:'#2CBAFF'
         //         color:'red',
         //         // color: function (params) {
         //         //     console.log(params);
         //         //     let colorList = ['#2CBAFF', '#FE7979'];
         //         //     alert(params.data[0].value)
         //         //     if (params.data[0] < 70) {
         //         //         return colorList[0];
         //         //     } else if (params.data[0] >= 70) {
         //         //         return colorList[1];
         //         //     }
         //         // },
         //     }
         // }, 删除
         lineStyle: {
             width: 4,
             color: '#29B8FF'
          },
          areaStyle: {
             normal: {
                 opacity: 0.9,
                 color: new echarts.graphic.RadialGradient(0.5, 0.5, 1, [
                 {
                     color: '#27B7FF',
                     offset: 0
                 },
                 {
                     color: '#5AD1FF',
                     offset: .4
                  }
               ])
            }
         }
       }
     ],
     itemStyle: {  -- 放到这里
        normal: {
           borderWidth: 2,
           color: function (params) {
           let colorList = ['#2CBAFF', '#FE7979'];
           for(let i = 0;i= 70) {
                     console.log(colorList[1])
               }
             }
          }
      }
    }
  }
]
这种写法会依次根据在控制台输出符合的颜色
-
第二,线图可以接受多个颜色,而雷达图radar只能接受一个颜色
我以为到这里已经结束了。
BUT。。。
当我把console.log换成return的时候。遍历数组,总是根据数组第一个值返回对应颜色,下面的不执行了,并把所有的拐点设置为第一个值符合的颜色。
简单来说,就是雷达图的颜色只接受一个参数。
换种思维
既然一组数据只能用一种颜色,我在绘制这个数组的时候,先做个遍历:
- 大于等于某值,生成一个数组,设置颜色1
- 小于某值,生成一个数组,设置颜色2
绘制
一个图表 设置三层覆盖
- 把所有数据绘制下来。不要圆点。只要线
- 把大于某数值的圆点绘制下来,设置蓝色
- 把小于某数值的圆点绘制下来,设置红色
#### 绘制了三个图表,有时间再详细解析。可以根据需要删除多余的。
预览地址


