java性能分析工具
NetBeans Profiler
The NetBeans profiler is a modular add on which is used to provide the profiling functionality for the NetBeans IDE, which is an open-source integrated development environment. NetBeans IDE supports development of all Java application types (Java SE (including JavaFX), Java ME, web, EJB and mobile applications) out of the box.
This profiler includes functions such as CPU, memory and threads profiling but also provides additional tools and functionality for basic JVM monitoring, which is extremely useful for developers who need to solve memory or performance-related issues.
JProfiler
JProfiler was previously mentioned in my previous article but remains a extremely good Java profiler combining CPU, Memory and Thread profiling into one application and is useful for developers as it can be used to analyze performance bottlenecks, memory leaks, CPU loads and resolve threading issues and supports local profiling (analysis of applications that are running on the same machine on which the JProfiler software is installed) and remote profiling (this is where it allows for the analysis of Java applications which are running on remote machines which JProfiler software is not installed on.).
JProfiler is a commercially licensed Java profiling tool developed by ej-technologies GmbH, and is mainly designed for use with Java EE and Java SE applications.
GC Viewer
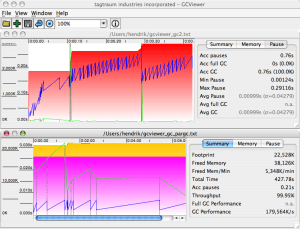
GC Viewer is available to be downloaded for free (from its website and GitHub)and is a open sourced tool which can be used to visualize data produced by the Java VM options using the vmflags -verbose:gc and -Xloggc:. GC Viewer can be used to calculate garbage collection related performance metrics which include throughput, accumulated pauses, longest pause and more. It is often very useful for when you want to tun the garbage collection of a particular application by changing generation sizes or setting up the initial heap size.
GC Viewer is an open sourced tool by tagtraum industries incorporated is a tiny Raleigh, North Carolina based software and consulting company founded in 2004 from the not-for-profit project tagtraum industries started in 1999.
VisualVM
VisualVM is a tool derived from the NetBeans platform and its architecture is modular in design meaning its easy to extend through the use of plugins.
Visual VM allows you to get detailed information about your Java applications while they are running on a Java Virtual Machine (JVM). Data generated can be generated and retrieved by the Java Development Kit (JDK) tools and all the data and information on multiple Java Applications can be viewed quickly both local and remote running applications. It is possible to also save and capture the data about the JVM software and save the data to the local system, and then view the data later or share it with others.
Visual VM can do CPU Profiling, memory Profiling, run garbage collections, take snapshots and more.
Java Performance Analysis Tool (Patty) *Beta
The “Patty” project is a open source project available to download from Source Forge and is aimed at providing a profiling tool for the Java 1.5.0 and higher Virtual Machines. It differentiates itself from other profilers through maintaining a very high emphasis on targeted profiling and allows users to switch profiling features on and off at runtime.
Currently its in state of beta but as some strong features such as analyses of method execution, code coverage, thread contention can be used for profiling overheads (memory CPU, etc) an have its information sent to other computers via the TCP/IP Socket, as a easy to use GUI and can be used to analyze heaps, and can instrument and de-instrument classes while your application is running. (preparation steps in a Java build cycle.
JRockit – Mission Control
JRockit is a proprietary Java Virtual Machine (JVM) originally developed by Appeal Virtual Machines and acquired by BEA Systems in 2002 and later became part of Oracle via Sun Microsystems.
Oracles JRockit is a complete solution for Java SE which includes a high-performance JVM, profiling, monitoring and diagnostics tools, and can be used for predicting latency in Java applications.
The current iteration of JRockit is bundled with a set of tools called JRockit Mission Control.The tools include: a console used for management and is capable of visualizing garbage-collection and other performance statistics. It can also be used as a runtime performance profiling tool called Runtime Analyzer and can also analyze memory issues.
Eclipse Memory Analyzer
The Eclipse Memory Analyzer is a Java heap analyzer that helps you find memory leaks and reduce memory consumption. It is more suited for being a general purpose toolkit to analyze Java heap dumps and calculation of its size. It can be used also reports leak suspects and memory consumption anti-patterns.
Java Interactive Profiler
JIP is a high performance, low overhead profiler that is written and developed in Java, it currently operates under a BSD licence and is available from Source Forge to download. For developers using JIP there is the the ability to turn the profiler on and off while the VM is running also it is possible to also filter out classes and packages and control the output.
Profiler4J
Profiler4j is a a dedicated CPU profiler Java that is user friendly and supports remote profiling and can be configured “on the fly”. Notable features include that its based on dynamic bytecode instrumentation, it as no native library nor requires an executable. Further notable features are that its done 100% in Java, can provide graphical information with a call graph, call tree, memory monitor, and class list. and supports fine-grained configuration. It is currently released under the Apache License v2.0 and is available to download from Source Forge.


