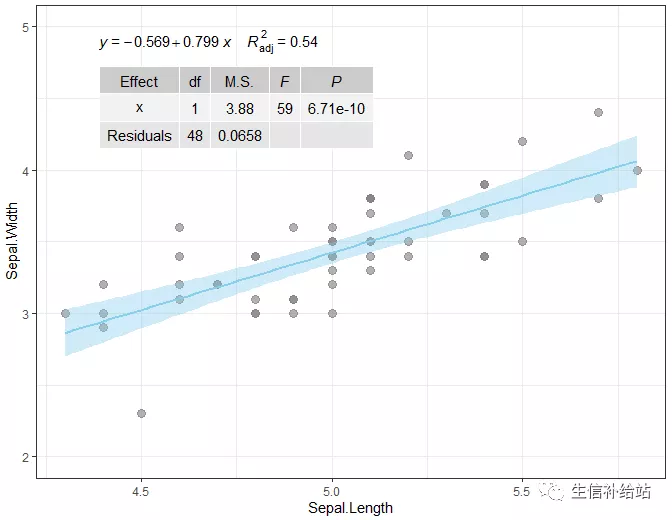
散点图绘制回归曲线很常用,那么添加上回归方程,P值,R2或者方差结果表等可以展示更量化的信息。
那加起来复杂吗?还真不一定!
一 载入数据和R包
使用内置数据集
library(ggplot2) #加载ggplot2包
library(dplyr) #加载dplyr包
library(ggpmisc) #加载ggpmisc包
#展示 使用Species为setosa的亚集
iris2 <- subset(iris,Species == "setosa")
二 回归曲线的可能性
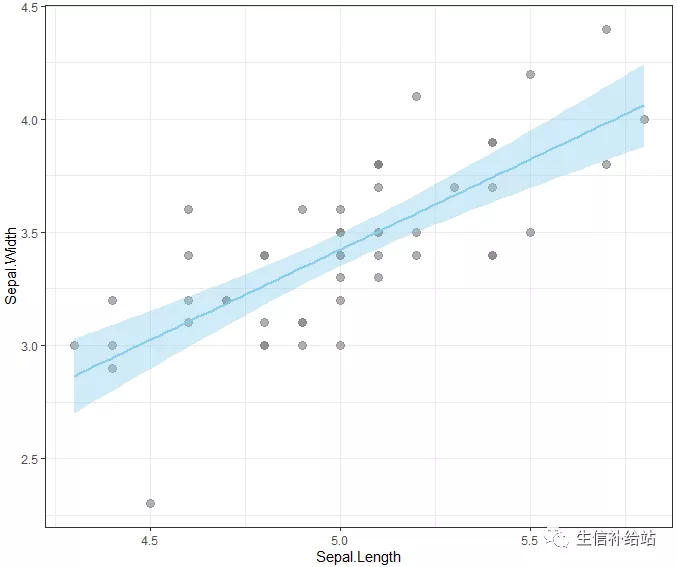
1, 绘制点图,添加回归线
#散点图
p <- ggplot(iris2, aes(Sepal.Length, Sepal.Width)) +
  geom_point(color = "grey50",size = 3, alpha = 0.6)
#回归线
#添加回归曲线
p + stat_smooth(color = "skyblue", fill = "skyblue", method = "lm")
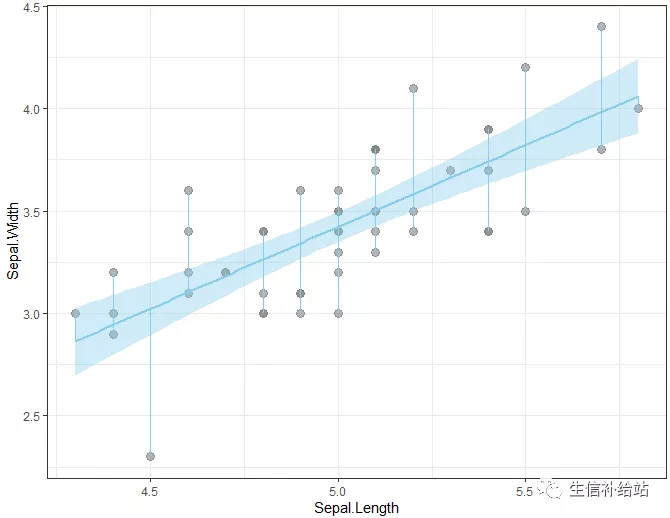
2, 连接点到线
p +
  stat_smooth(color = "skyblue", formula = y ~ x,fill = "skyblue", method = "lm")+
  stat_fit_deviations(formula = y ~ x, color = "skyblue")
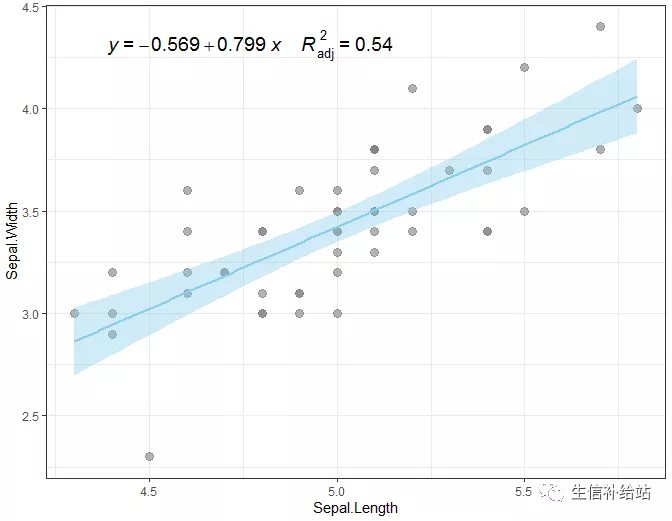
3,添加回归公式
stat_poly_eq参数添加公式,内含参数可调整位置等
p +
  stat_smooth(color = "skyblue", formula = y ~ x,fill = "skyblue", method = "lm") +
  stat_poly_eq(
    aes(label = paste(..eq.label.., ..adj.rr.label.., sep = '~~~~')),
    formula = y ~ x,  parse = TRUE,
      size = 5, #公式字体大小
      label.x = 0.1,  #位置 ,0-1之间的比例
      label.y = 0.95)
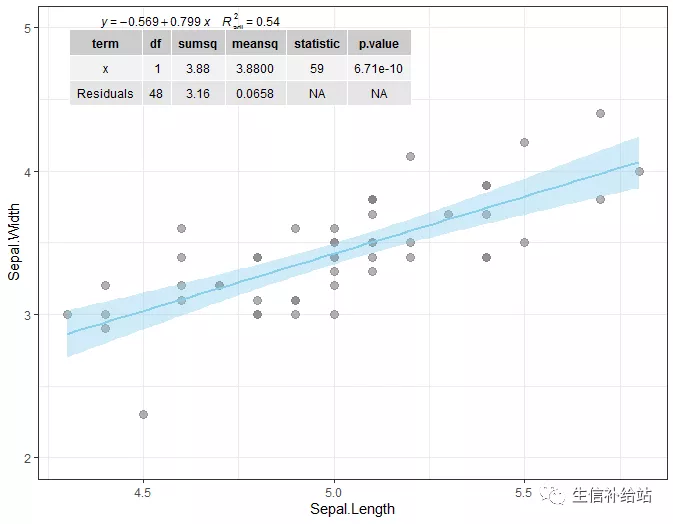
4, 添加方差结果表
p +  ylim(2,5) +
  stat_smooth(color = "skyblue", formula = y ~ x,fill = "skyblue", method = "lm") +
  stat_poly_eq(
    aes(label = paste(..eq.label.., ..adj.rr.label.., sep = '~~~~')),
    formula = y ~ x,  parse = TRUE,size = 3,label.x = 0.1, label.y = 0.99) +
  stat_fit_tb(tb.type = 'fit.anova',
 label.y.npc = "top", label.x.npc = "left",
 )
注:此处仅为展示 ,label.y.npc 为另一种调整位置的方式 ,用label.y可完全避免重叠
如担心方差表和公示与图重叠,可以通过ggplot2 的 ylim和xlim适当调整,然后调整位置即可。
5,细节优化方差表
上述方差表中的行名,列名,以及NA,,,稍加调整后,看起来更“专业”!
p +  ylim(2,5) +
  stat_smooth(color = "skyblue", formula = y ~ x,fill = "skyblue", method = "lm") +
  stat_poly_eq(
    aes(label = paste(..eq.label.., ..adj.rr.label.., sep = '~~~~')),
    formula = y ~ x,  parse = TRUE,size = 4,label.x = 0.1, label.y = 0.95) +
  stat_fit_tb(method = "lm",
              method.args = list(formula = y ~ x),
              tb.type = "fit.anova",
              tb.vars = c(Effect = "term",
                          "df",
                          "M.S." = "meansq",
                          "italic(F)" = "statistic",
                          "italic(P)" = "p.value"),
              label.y = 0.87, label.x = 0.1,
              size = 4,
              parse = TRUE
 ) +
theme_classic()
其他:既然是ggplot2的扩展包,ggplot2的一些参数亦可使用:
ggplot2|详解八大基本绘图要素
ggplot2|theme主题设置,详解绘图优化-“精雕细琢”
ggplot2 |legend参数设置,图形精雕细琢
ggplot2|ggpubr进行“paper”组图合并
参考资料:
https://github.com/cran/ggpmisc
◆ ◆ ◆ ◆ ◆
精心整理(含图版)|R语言生信分析,可视化,你要的全拿走,建议收藏!
