python matplot绘图整理,中文显示,坐标轴,标记,柱状图
1. 中文标注
windows+linux
plt.rcParams['font.sans-serif'] = ['SimHei'] # 步骤一(替换sans-serif字体)
plt.rcParams['axes.unicode_minus'] = False # 步骤二(解决坐标轴负数的负号显示问题)
Mac
from matplotlib.font_manager import FontManager
fm = FontManager()
mat_fonts = set(f.name for f in fm.ttflist)
print(mat_fonts)

plt.rcParams['font.sans-serif'] = ['Arial Unicode MS']
2. 表头
plt.title(ylabel, fontsize=fs)
3. xy轴边界
plt.xlim(0.5, 5.5)
plt.ylim(0.5, 1.0)
4. xy轴刻度
plt.xticks(range(10)) # 设置x刻度
plt.yticks([0,0.2,0.4,0.6,0.8,1.0,1.2]) # 设置y刻度
5. xy轴标签
fig.set_xticklabels('%.1f'%i for i in range(10) , fontsize=12 )# x轴刻度标签
fig.set_yticklabels("%.2f" %i for i in [0,0.2,0.4,0.6,0.8,1.0,1.2]) # y轴刻度标签
6. 图例
plt.legend(loc = 'best')
# 显示图例,loc表示位置
# 'best' : 0, (only implemented for axes legends)(自适应方式)
# 'upper right' : 1,
# 'upper left' : 2,
# 'lower left' : 3,
# 'lower right' : 4,
# 'right' : 5,
# 'center left' : 6,
# 'center right' : 7,
# 'lower center' : 8,
# 'upper center' : 9,
# 'center' : 10,
7. 在图中显示文字标注
#三个参数分别为x,y,要显示的内容
plt.text(xloc,yloc,str)
8. 多张图
#定义figrue
plt.figure(figsize=(18,8))
ax = plt.subplot2grid( (2,2) , 0 , 0 )
ax.plot(x , y ,'*--' , c='r' , label=’x1’)
9. 柱状图
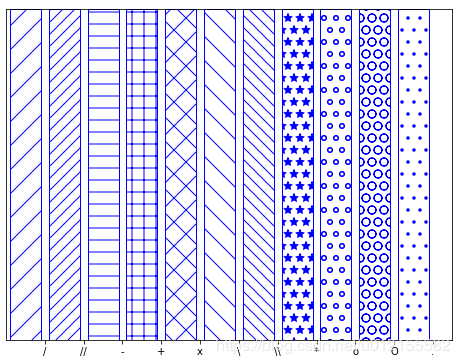
ax.bar(x , line1,color='white', edgecolor='black' , hatch='//')
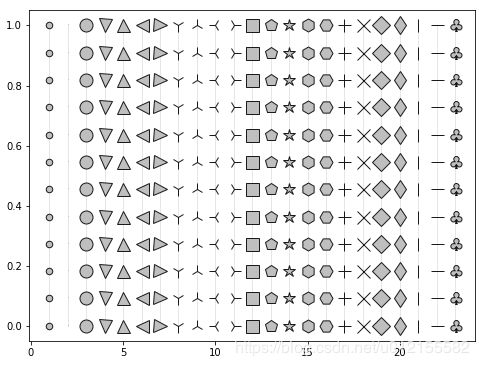
Y = np.linspace(0,1,12)
X = np.ones(Y.size)
markers = ['.',',','o','v','^','<','>','1','2','3','4',
's','p','*','h','H','+','x','D','d','|','_', r'$\clubsuit$']
fig = plt.figure(figsize=(8,6), dpi=72, facecolor="white")
axes = plt.subplot(111)
for i,marker in enumerate(markers):
axes.plot( (1+i)*X, Y, color = '0.9', linewidth=1,
markersize = 13, marker=marker, markeredgecolor = '0.10', markerfacecolor = '0.75')
plt.show()
import numpy as np
import matplotlib.pyplot as plt
X = np.linspace(0,1,10)
Y = np.ones(X.size)
patterns = ('/','//','-', '+', 'x', '\\', '\\\\', '*', 'o', 'O', '.')
fig = plt.figure(figsize=(8,6), dpi=72, facecolor="white")
axes = plt.subplot(111)
for i,pattern in enumerate(patterns):
axes.bar( .5+i, 1, hatch=pattern, color='white', edgecolor='blue',)
axes.set_xlim(0,len(patterns)+.5)
axes.set_ylim(0,1)
axes.set_yticks([])
axes.set_xticks(np.arange(1,len(patterns)+1))
axes.set_xticklabels(patterns)
plt.show()
10. 美化风格
plt.style.use('ggplot')

