下载jmx_exporter的jar包
https://repo1.maven.org/maven2/io/prometheus/jmx/jmx_prometheus_javaagent/0.3.1/jmx_prometheus_javaagent-0.3.1.jar
创建配置文件namenode.yaml(datanode.yaml)放在任意位置,内容为你想要的metrics
参考配置:
---
startDelaySeconds: 0
hostPort: master:1234 #master为本机IP(一般可设置为localhost);1234为想设置的jmx端口(可设置为未被占用的端口)
#jmxUrl: service:jmx:rmi:///jndi/rmi://127.0.0.1:1234/jmxrmi
ssl: false
lowercaseOutputName: false
lowercaseOutputLabelNames: false
其他参数参考:
| Name | Description |
|---|---|
| startDelaySeconds | start delay before serving requests. Any requests within the delay period will result in an empty metrics set. |
| hostPort | The host and port to connect to via remote JMX. If neither this nor jmxUrl is specified, will talk to the local JVM. |
| username | The username to be used in remote JMX password authentication. |
| password | The password to be used in remote JMX password authentication. |
| jmxUrl | A full JMX URL to connect to. Should not be specified if hostPort is. |
| ssl | Whether JMX connection should be done over SSL. To configure certificates you have to set following system properties:-Djavax.net.ssl.keyStore=/home/user/.keystore-Djavax.net.ssl.keyStorePassword=changeit-Djavax.net.ssl.trustStore=/home/user/.truststore-Djavax.net.ssl.trustStorePassword=changeit |
| lowercaseOutputName | Lowercase the output metric name. Applies to default format and name. Defaults to false. |
| lowercaseOutputLabelNames | Lowercase the output metric label names. Applies to default format and labels. Defaults to false. |
| whitelistObjectNames | A list of ObjectNames to query. Defaults to all mBeans. |
| blacklistObjectNames | A list of ObjectNames to not query. Takes precedence over whitelistObjectNames. Defaults to none. |
| rules | A list of rules to apply in order, processing stops at the first matching rule. Attributes that aren't matched aren't collected. If not specified, defaults to collecting everything in the default format. |
| pattern | Regex pattern to match against each bean attribute. The pattern is not anchored. Capture groups can be used in other options. Defaults to matching everything. |
| attrNameSnakeCase | Converts the attribute name to snake case. This is seen in the names matched by the pattern and the default format. For example, anAttrName to an_attr_name. Defaults to false. |
| name | The metric name to set. Capture groups from the pattern can be used. If not specified, the default format will be used. If it evaluates to empty, processing of this attribute stops with no output. |
| value | Value for the metric. Static values and capture groups from the pattern can be used. If not specified the scraped mBean value will be used. |
| valueFactor | Optional number that value (or the scraped mBean value if value is not specified) is multiplied by, mainly used to convert mBean values from milliseconds to seconds. |
| labels | A map of label name to label value pairs. Capture groups from pattern can be used in each. name must be set to use this. Empty names and values are ignored. If not specified and the default format is not being used, no labels are set. |
| help | Help text for the metric. Capture groups from pattern can be used. name must be set to use this. Defaults to the mBean attribute decription and the full name of the attribute. |
| type | The type of the metric, can be GAUGE, COUNTER or UNTYPED. name must be set to use this. Defaults to UNTYPED. |
修改$HADOOP_HOME/etc/hadoop/hadoop-env.sh
NameNode节点添加:
export HADOOP_NAMENODE_OPTS="-Dcom.sun.management.jmxremote.authenticate=false -Dcom.sun.management.jmxremote.ssl=false -Dcom.sun.management.jmxremote.local.only=false -Dcom.sun.management.jmxremote.port=1234 $HADOOP_NAMENODE_OPTS "
DataNode节点添加:
export HADOOP_DATANODE_OPTS="-Dcom.sun.management.jmxremote.authenticate=false -Dcom.sun.management.jmxremote.ssl=false -Dcom.sun.management.jmxremote.local.only=false -Dcom.sun.management.jmxremote.port=1235 $HADOOP_DATANODE_OPTS "
提示:
端口1234(1235)要与之前设置的jmx端口保持一致
修改
$HADOOP_HOME/bin/hdfs
export HADOOP_NAMENODE_OPTS="$HADOOP_NAMENODE_OPTS -javaagent:/home/hadoop/jmx_prometheus_javaagent-0.3.1.jar=9200:/home/hadoop/namenode.yaml"
export HADOOP_DATANODE_OPTS="$HADOOP_DATANODE_OPTS -javaagent:/home/hadoop/jmx_prometheus_javaagent-0.3.1.jar=9300:/home/hadoop/datanode.yaml"
提示:9200(9300)为jmx_exporter提供metrics数据端口,后续Prometheus从此端口获取数据
访问http://master:9200/metrics就能获得需要的metrics数据:
# HELP jvm_buffer_pool_used_bytes Used bytes of a given JVM buffer pool.
# TYPE jvm_buffer_pool_used_bytes gauge
jvm_buffer_pool_used_bytes{pool="direct",} 1181032.0
jvm_buffer_pool_used_bytes{pool="mapped",} 0.0
# HELP jvm_buffer_pool_capacity_bytes Bytes capacity of a given JVM buffer pool.
# TYPE jvm_buffer_pool_capacity_bytes gauge
jvm_buffer_pool_capacity_bytes{pool="direct",} 1181032.0
jvm_buffer_pool_capacity_bytes{pool="mapped",} 0.0
# HELP jvm_buffer_pool_used_buffers Used buffers of a given JVM buffer pool.
...
下载Prometheus
https://prometheus.io/download/
解压
修改配置文件 prometheus.yml
添加
  - job_name: hadoop-master

    static_configs:
      - targets: ['localhost:9200']

  - job_name: hadoop-slave1

    static_configs:
      - targets: ['slave1:9300']
运行
./prometheus
http://master:9090/targets查看是否添加成功
成功则增加master,slave1
如下图
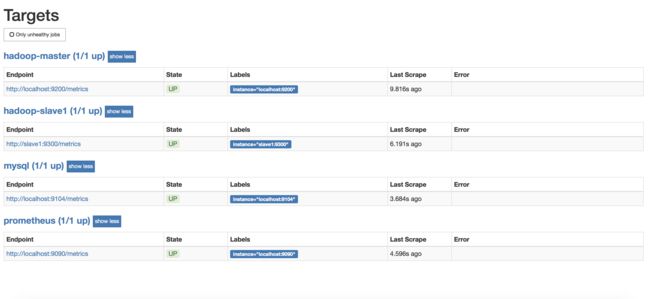
通过点击http://localhost:9200/metrics可以看到metrics数据
下载Grafana
https://grafana.com/grafana/download?platform=linux
安装相应版本grafana
启动grafana
systemctl start grafana-server
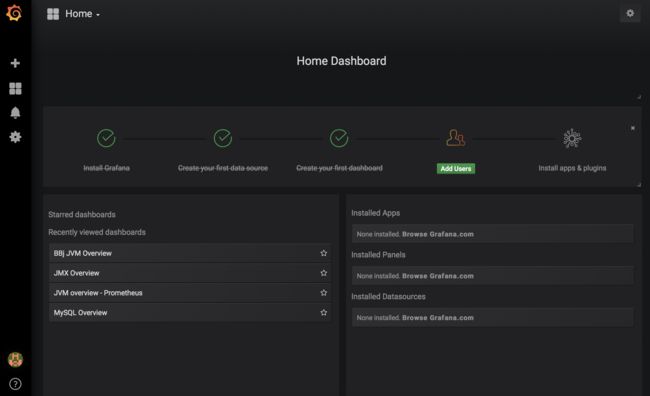
启动后,即可通过http://master:3000/来访问了(默认账号密码是admin/admin)
如下图
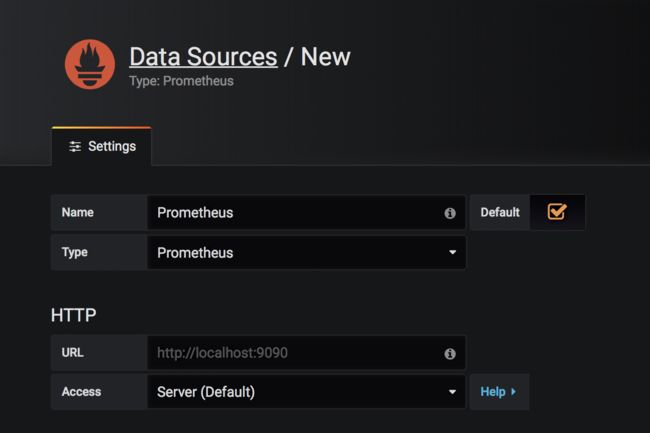
关联Grafana和Prometheus
点击Data Sources
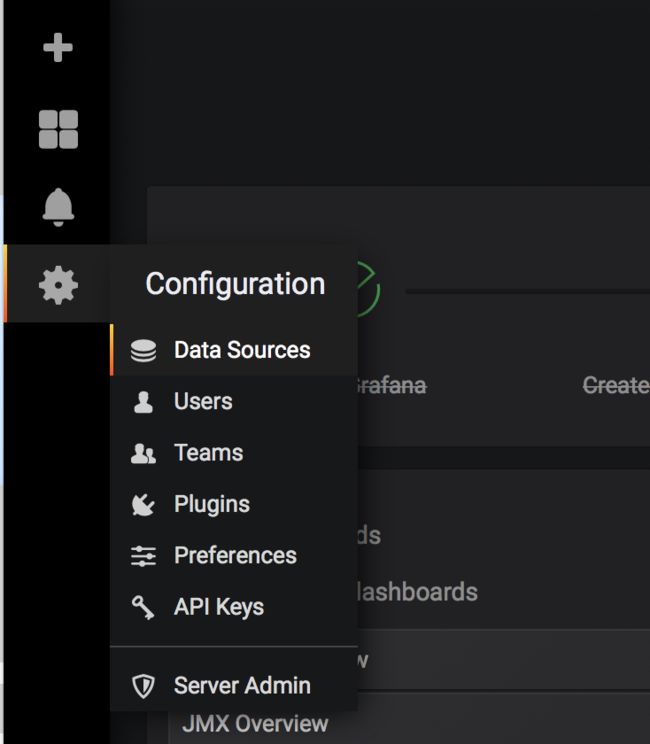
点击Add data source,填写数据保存
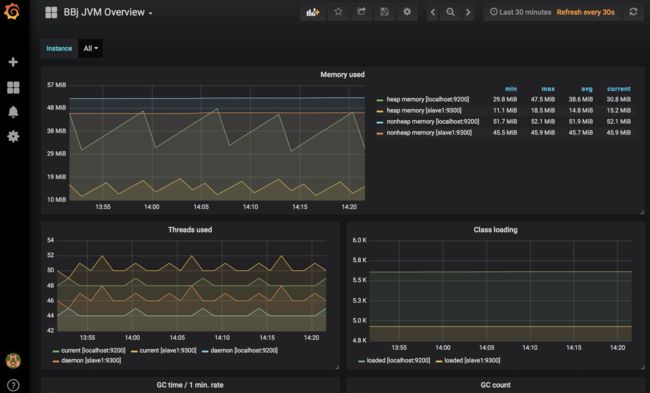
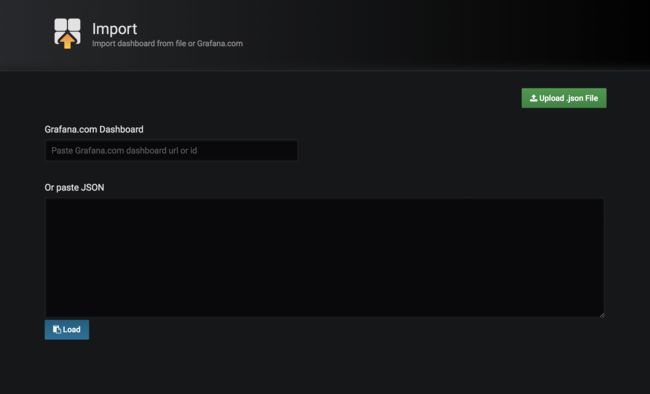
添加一个dashboard,如下图进入dashboard导入页面

点击Upload .json File,导入模版(可从https://grafana.com/dashboards下载)
导入成功后可以看到类似如下效果,完成!