1.绘制正弦函数和余弦函数,没有使用hold on,最后面的plot图像会覆盖前面的plot图像;
t=[0:0.01:1];
y1=sin(2*pi*4*t);
plot(t,y1);
y2=cos(2*pi*4*t);
plot(t,y2);
2.使用hold函数,hold on可以在同一个figure坐标系中绘制两个图形,通过plot的第三个可选参数赋值'r'设置为红色;
t=[0:0.01:1];
y1=sin(2*pi*4*t);
y2=cos(2*pi*4*t);
plot(t,y1);
hold on
plot(t,y2,'r');
3.xlable设置横轴标签,ylabel设置纵轴标签,lengend设置图例,其中[py1(1),py2(1)]为了让图例与图形样式一致,title设置标题;
t=[0:0.01:1];
y1=sin(2*pi*4*t);
y2=cos(2*pi*4*t);
py1=plot(t,y1,'b');
hold on
py2=plot(t,y2,'r');
xlabel('time (t)');
ylabel('value (y)');
legend([py1(1),py2(1)],'y1=sin(2*pi*4*t)','y2=cos(2*pi*4*t)');
title('sin and cos graphics');
4.将figure中的图形导出为.png图像文件;
print -dpng 'myplot.png'
5.通过close命令可以关闭当前一个figure图形窗口;
6.打开多个figure图形窗口;
t=[0:0.01:1];
y1=sin(2*pi*4*t);
y2=cos(2*pi*4*t);

figure(1);
plot(t,y1,'b');
figure(2);
plot(t,y2,'r');
7.subplot(1,2,1)第一、第二个参数把一个图形窗口分割为1行2列格子区域,第三个参数表示在第一个格子区域内绘图;
t=[0:0.01:1];
y1=sin(2*pi*4*t);
y2=cos(2*pi*4*t);

subplot(1,2,1);
plot(t,y1,'b');
subplot(1,2,2);
plot(t,y2,'r');
8.改变当前plot图形刻度范围x轴为[0.5,1]和y轴为[-1,1];
axis([0.5,1,-1,1]);
9.clf清除一个figure窗口内所以图形;
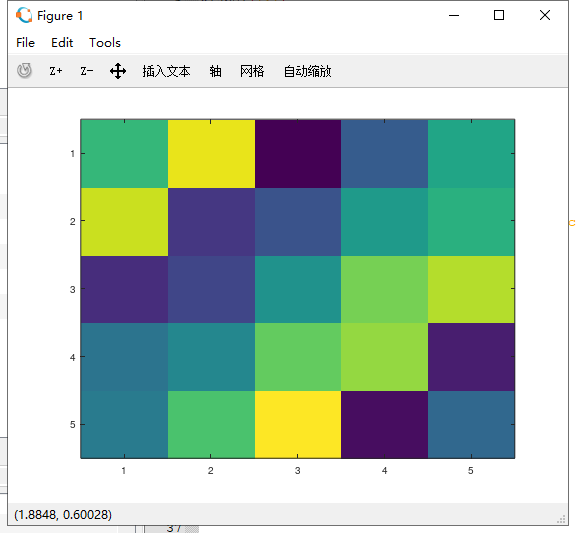
10.生成一个5*5魔方矩阵A,使用函数imagesc将其可视化,每中颜色表示一个值;
A=magic(5);
imagesc(A);
11.一次运行3个命令,用,号分开,使用灰度表示矩阵A,右边添加颜色条;
A=magic(5);
imagesc(A),colorbar,colormap gray;
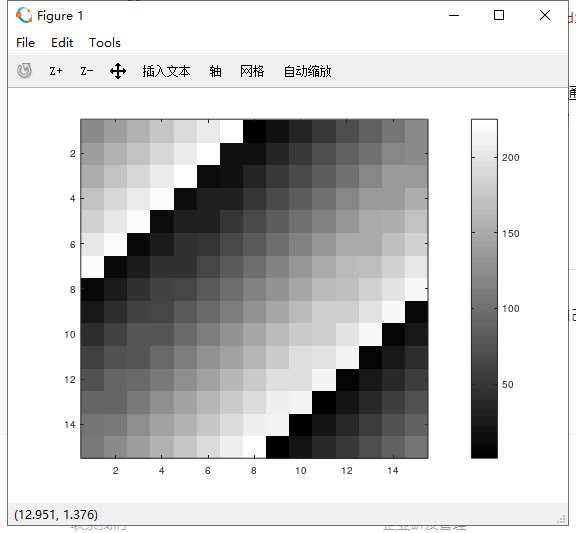
12.通过imagesc可视化更大的15*15的魔方矩阵,3个命令通过逗号,连接一起,也相当于分号;,也叫逗号连接的命令/函数;
imagesc(magic(15)),colorbar,colormap gray;


