python绘图 ——绘制常用图形(matplotlib、pyecharts、plotly)
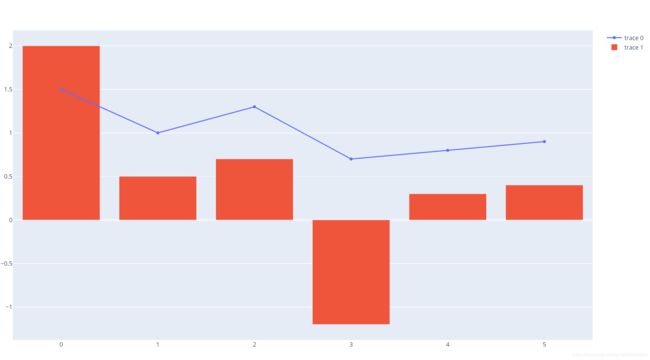
1 plotly画柱状图和折线图
#柱状图+折线图
import plotly.graph_objects as go
fig = go.Figure()
fig.add_trace(
    go.Scatter(
        x=[0, 1, 2, 3, 4, 5],
        y=[1.5, 1, 1.3, 0.7, 0.8, 0.9]
    ))
fig.add_trace(
    go.Bar(
        x=[0, 1, 2, 3, 4, 5],
        y=[2, 0.5, 0.7, -1.2, 0.3, 0.4]
    ))
fig.show()
2 seaborn绘制热力图
# 导入库
import seaborn as sns
import pandas as pd
import numpy as np
import matplotlib.pyplot as plt

# 生成数据集
data = np.random.random((6,6))
np.fill_diagonal(data,np.ones(6))
features = ["prop1","prop2","prop3","prop4","prop5", "prop6"]
data = pd.DataFrame(data, index = features, columns=features)
print(data)
# 绘制热力图
heatmap_plot = sns.heatmap(data, center=0, cmap='gist_rainbow')
plt.show()
3 matplotlib绘制折线图
先定义一个函数模块,名称为:example_utils.py,里面包括三个函数,各自功能如下:
import matplotlib.pyplot as plt

# 创建画图fig和axes
def setup_axes():
    fig, axes = plt.subplots(ncols=3, figsize=(6.5,3))
    for ax in fig.axes:
        ax.set(xticks=[], yticks=[])
    fig.subplots_adjust(wspace=0, left=0, right=0.93)
    return fig, axes
# 图片标题
def title(fig, text, y=0.9):
    fig.suptitle(text, size=14, y=y, weight='semibold', x=0.98, ha='right',
                 bbox=dict(boxstyle='round', fc='floralwhite', ec='#8B7E66',
                           lw=2))
# 为数据添加文本注释
def label(ax, text, y=0):
    ax.annotate(text, xy=(0.5, 0.00), xycoords='axes fraction', ha='center',
                style='italic',
                bbox=dict(boxstyle='round', facecolor='floralwhite',
                          ec='#8B7E66'))
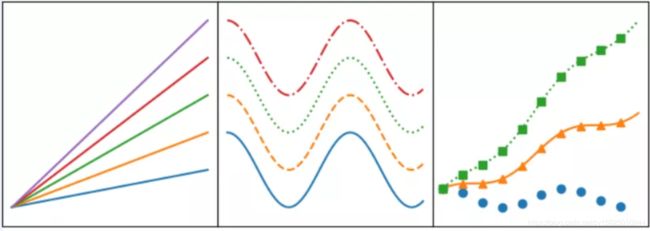
绘制折线图代码:
import numpy as np
import matplotlib.pyplot as plt
import example_utils

x = np.linspace(0, 10, 100)
fig, axes = example_utils.setup_axes()
for ax in axes:
    ax.margins(y=0.10)
# 子图1 默认plot多条线,颜色系统分配
for i in range(1, 6):
    axes[0].plot(x, i * x)

# 子图2 展示线的不同linestyle
for i, ls in enumerate(['-', '--', ':', '-.']):
    axes[1].plot(x, np.cos(x) + i, linestyle=ls)

# 子图3 展示线的不同linestyle和marker
for i, (ls, mk) in enumerate(zip(['', '-', ':'], ['o', '^', 's'])):
    axes[2].plot(x, np.cos(x) + i * x, linestyle=ls, marker=mk, markevery=10)

# 设置标题
# example_utils.title(fig, '"ax.plot(x, y, ...)": Lines and/or markers', y=0.95)
# 保存图片
fig.savefig('plot_example.png', facecolor='none')
# 展示图片
plt.show()
4 matplotlib散点图
先定义一个函数模块名称为:example_utils.py,里面包括三个函数,源代码同上折线图
散点图代码:
"""
散点图的基本用法
"""
import numpy as np
import matplotlib.pyplot as plt
import example_utils

# 随机生成数据
np.random.seed(1874)
x, y, z = np.random.normal(0, 1, (3, 100))
t = np.arctan2(y, x)
size = 50 * np.cos(2 * t)**2 + 10
fig, axes = example_utils.setup_axes()
# 子图1
axes[0].scatter(x, y, marker='o',  color='darkblue', facecolor='white', s=80)
example_utils.label(axes[0], 'scatter(x, y)')
# 子图2
axes[1].scatter(x, y, marker='s', color='darkblue', s=size)
example_utils.label(axes[1], 'scatter(x, y, s)')
# 子图3
axes[2].scatter(x, y, s=size, c=z,  cmap='gist_ncar')
example_utils.label(axes[2], 'scatter(x, y, s, c)')
# example_utils.title(fig, '"ax.scatter(...)": Colored/scaled markers',#                     y=0.95)
fig.savefig('scatter_example.png', facecolor='none')
plt.show()
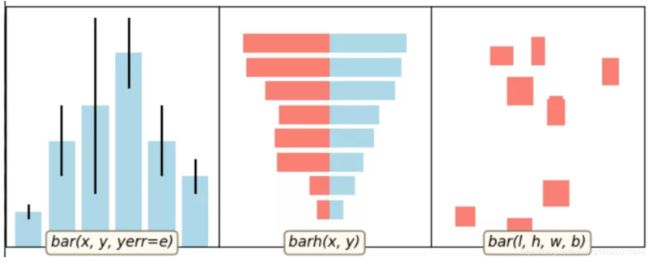
5 matplotlib柱状图
import numpy as np
import matplotlib.pyplot as plt

import example_utils


def main():
    fig, axes = example_utils.setup_axes()

    basic_bar(axes[0])
    tornado(axes[1])
    general(axes[2])

    # example_utils.title(fig, '"ax.bar(...)": Plot rectangles')
    fig.savefig('bar_example.png', facecolor='none')
    plt.show()

# 子图1
def basic_bar(ax):
    y = [1, 3, 4, 5.5, 3, 2]
    err = [0.2, 1, 2.5, 1, 1, 0.5]
    x = np.arange(len(y))
    ax.bar(x, y, yerr=err, color='lightblue', ecolor='black')
    ax.margins(0.05)
    ax.set_ylim(bottom=0)
    example_utils.label(ax, 'bar(x, y, yerr=e)')

# 子图2
def tornado(ax):
    y = np.arange(8)
    x1 = y + np.random.random(8) + 1
    x2 = y + 3 * np.random.random(8) + 1
    ax.barh(y, x1, color='lightblue')
    ax.barh(y, -x2, color='salmon')
    ax.margins(0.15)
    example_utils.label(ax, 'barh(x, y)')

# 子图3
def general(ax):
    num = 10
    left = np.random.randint(0, 10, num)
    bottom = np.random.randint(0, 10, num)
    width = np.random.random(num) + 0.5
    height = np.random.random(num) + 0.5
    ax.bar(left, height, width, bottom, color='salmon')
    ax.margins(0.15)
    example_utils.label(ax, 'bar(l, h, w, b)')
##运行
if __name__=="__main__":
    main()
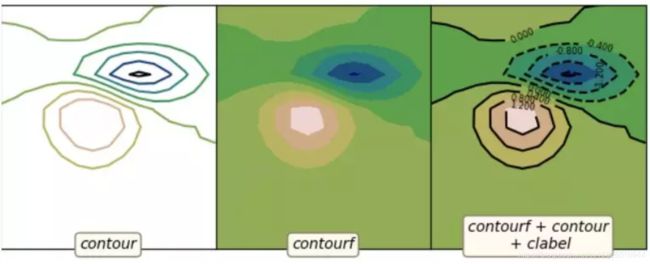
6 matplotlib等高线图
import matplotlib.pyplot as plt
import numpy as np
from matplotlib.cbook import get_sample_data

import example_utils

z = np.load(get_sample_data('bivariate_normal.npy'))

fig, axes = example_utils.setup_axes()

axes[0].contour(z, cmap='gist_earth')
example_utils.label(axes[0], 'contour')

axes[1].contourf(z, cmap='gist_earth')
example_utils.label(axes[1], 'contourf')

axes[2].contourf(z, cmap='gist_earth')
cont = axes[2].contour(z, colors='black')
axes[2].clabel(cont, fontsize=6)
example_utils.label(axes[2], 'contourf + contour\n + clabel')

# example_utils.title(fig, '"contour, contourf, clabel": Contour/label 2D data',
#                     y=0.96)
fig.savefig('contour_example.png', facecolor='none')

plt.show()
7 matplotlib绘制动画
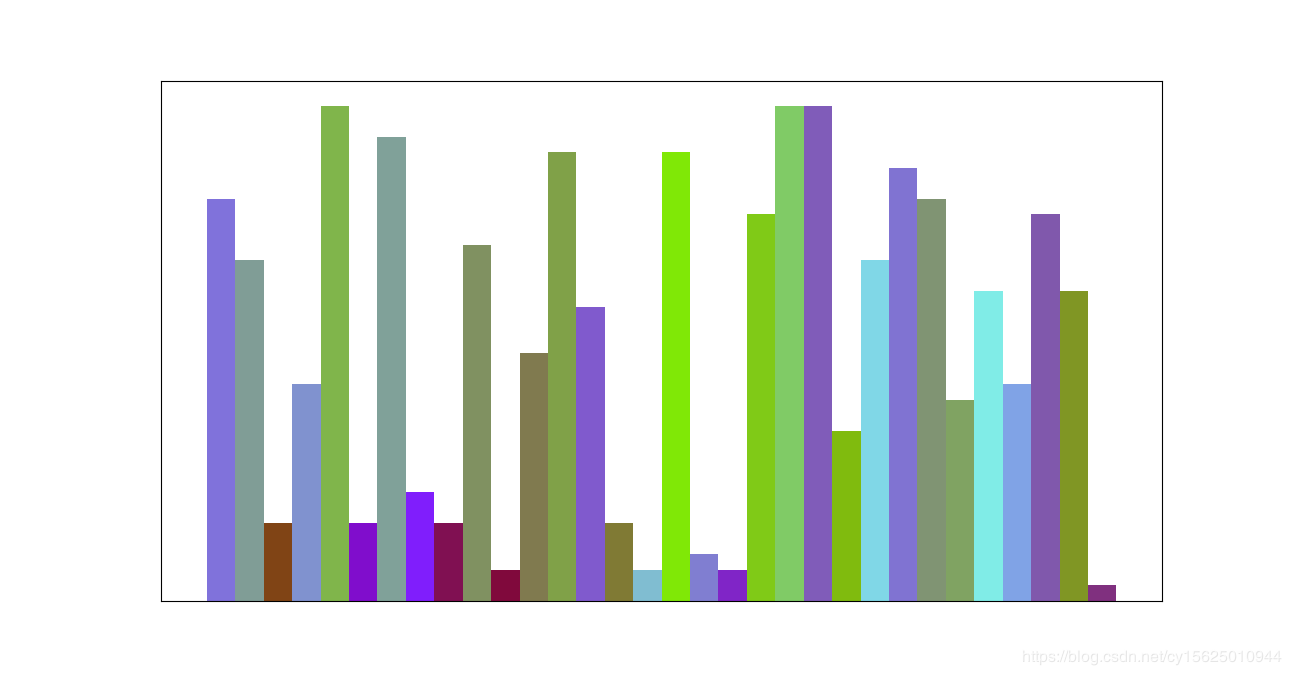
matplotlib是python中最经典的绘图包,里面animation模块能绘制动画。
首先导入小例子使用的模块:
from matplotlib import pyplot as plt
from matplotlib import animation
from random import randint, random
生成数据,frames_count是帧的个数,data_count每个帧的柱子个数
class Data:
    data_count = 32
    frames_count = 2

    def __init__(self, value):
        self.value = value
        self.color = (0.5, random(), random()) #rgb

    # 造数据
    @classmethod
    def create(cls):
        return [[Data(randint(1, cls.data_count)) for _ in range(cls.data_count)]
                for frame_i in range(cls.frames_count)]
绘制动画:animation.FuncAnimation函数的回调函数的参数fi表示第几帧,注意要调用axs.cla()清除上一帧。
def draw_chart():
    fig = plt.figure(1, figsize=(16, 9))
    axs = fig.add_subplot(111)
    axs.set_xticks([])
    axs.set_yticks([])
    # 生成数据
    frames = Data.create()
    def animate(fi):
        axs.cla()  # clear last frame
        axs.set_xticks([])
        axs.set_yticks([])
        return axs.bar(list(range(Data.data_count)),        # X
                       [d.value for d in frames[fi]],       # Y
                       1,                                   # width
                       color=[d.color for d in frames[fi]]  # color
                       )
    # 动画展示
    anim = animation.FuncAnimation(fig, animate, frames=len(frames))
    plt.show()
draw_chart()
测试结果:
绘图素材和参考来源:https://github.com/jackzhenguo/python-small-examples
