论文阅读:social lstm:Human Trajectory Prediction in Crowded Spaces
社会LSTM:拥挤空间中的人类轨迹预测
学习笔记参考:study note: https://www.zybuluo.com/ArrowLLL/note/981714
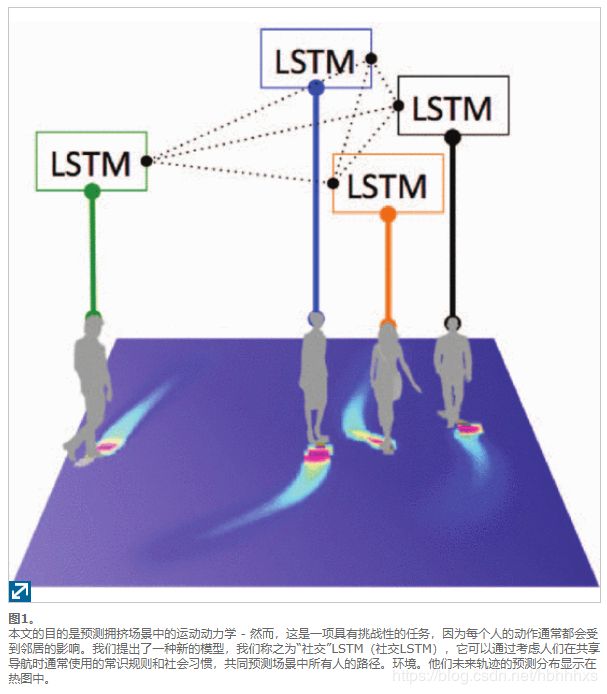
摘要:行人遵循不同的轨迹以避开障碍物并容纳行人。任何导航这样一个场景的自动驾驶车辆都应该能够预见到行人的未来位置并相应地调整其路径以避免碰撞。轨迹预测的这个问题可以被视为序列生成任务,我们有兴趣根据他们过去的位置预测人的未来轨迹。在最近成功的用于序列预测任务的递归神经网络(RNN)模型之后,我们提出了一种LSTM模型,该模型可以学习一般人类运动并预测他们未来的轨迹。这与使用社会力量等手工制作功能的传统方法形成对比。我们在几个公共数据集上演示了我们方法的性能。我们的模型在某些数据集上优于最先进的方法。我们还分析了我们的模型预测的轨迹,以展示我们的模型所学习的运动行为。
传统方法的限制:i)他们使用手工制作的功能来为特定设置建模“交互”,而不是以数据驱动的方式推断它们。这导致有利于捕获简单交互(例如排斥/吸引力)的模型,并且可能无法推广更复杂的拥挤设置。ii)他们专注于建立彼此非常接近的人之间的互动(以避免直接碰撞)。但是,他们预计不会在更遥远的未来发生相互作用。
我们还分析了模型生成的轨迹模式,以了解从轨迹数据集中学到的社会约束。
3.1Social LSTM
每个人都有不同的运动模式:它们以不同的速度,加速度和不同的步态移动。我们需要一个能够从与人对应的有限的初始观察中理解和学习这种特定于人的运动特性的模型。
Social pooling of hidden states
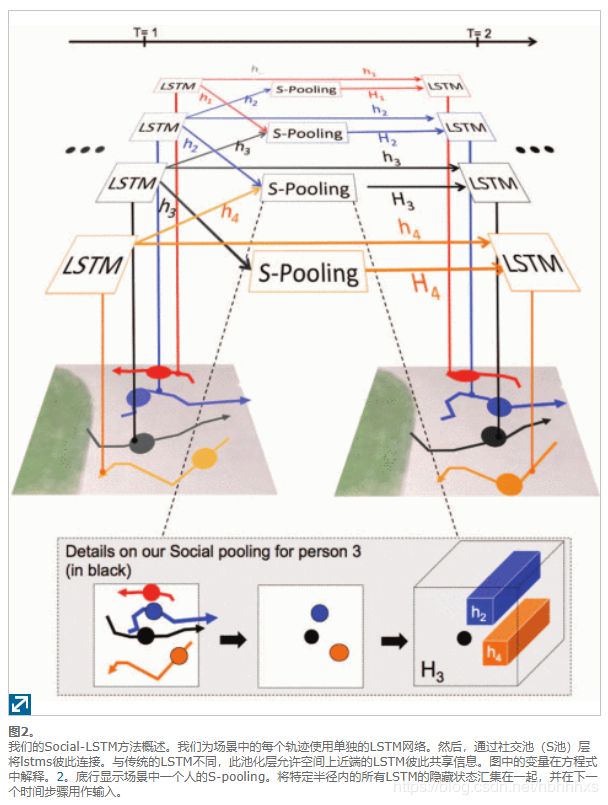
为了共同推理多个人,我们在相邻的LSTMS之间共享状态。这引入了一个新的挑战:每个人都有不同数量的邻居,而且人群非常密集,这个数字可能非常高。因此,我们需要一种紧凑的表示,它结合了所有邻居的信息。我们通过引入“社交”汇集层来处理这个问题,如图2所示。在每个时间步,LSTM小区从邻居的LSTM小区接收合并的隐藏状态信息。在汇集信息时,我们尝试通过基于网格的池来保留空间信息,如下所述。
在行人行为分析当中,为每一个行人建立一个LSTM模型,在t与t+1时刻之间加入一个 Social Pooling层,根据空间信息汇聚其他LSTM的state信息后得到一个3维的tensor(两个维度是平面坐标,第三个维度是t时刻的LSTM输出的state向量),输入下一个时刻。以此来汇聚其他LSTM的信息影响当前行人的运动轨迹。
隐藏状态汇聚
在行人行为分析当中,为每一个行人建立一个LSTM模型,在t与t+1时刻之间加入一个 Social Pooling层,根据空间信息汇聚其他LSTM的state信息后得到一个3维的tensor(两个维度是平面坐标,第三个维度是t时刻的LSTM输出的state向量),输入下一个时刻。以此来汇聚其他LSTM的信息影响当前行人的运动轨迹。
- LSTM模型的隐藏状态
 捕获到第 i 个人在第 t 时刻的隐藏状态信息;
 -
通过建立隐藏状态张量
 和邻居分享隐藏状态信息 :
给定隐藏状态维度为 D 以及相邻区域边界大小N0,对于第 i 个轨迹我们建立一个大小为 N0*N0*D 的张量
 :
: -
将汇聚得到的张量映射到一个向量
 ,将坐标映射到一个向量
 是映射函数,使用ReLU增加非线性
 和
和  是映射的权重
- LSTM的参数用
 表示
表示
位置估计
对于位置预测,则是通过将S-LSTM的输出编码成为二维高斯分布(bivariate Gaussian distribution)的参数,预测得到的新的坐标通过 ![]() 给出。
给出。
t 时刻的隐藏状态用于预测 t+1 时刻的轨迹位置 ![]() 分布。假定一个二元高斯分布的参数如下 :
分布。假定一个二元高斯分布的参数如下 :
- 期望
- 标准差
- 相关系数
这些参数通过一个带有5*D大小的矩阵
的线性层预测得到
在时刻 t 预测的位置坐标 ![]() ,通过以下方式得到 :
,通过以下方式得到 :
LSTM模型的参数通过最小化最小化负对数似然损失函数(![]() 表示第
表示第![]() 个轨迹)获得 :
个轨迹)获得 :
在训练集的所有轨迹中通过最小化损失来训练模型。
模型实现的细节
- 将空间坐标信息转化为64维度的向量再输入LSTM模型;
- 空间汇聚尺度 N0 设置为32,每一个小格使用 8*8 的汇聚窗口
- 固定LSTM隐藏层输出状态维度为 128
- 在汇聚LSTM隐藏状态之前将隐藏状态信息使用一个带有ReLU的embedding层转化一下(具体维度多少论文没有说明,猜想还是128,单纯地加一个ReLU即可
- 超参数用交叉验证的方式获得
- 使用均方误差以及0.003的学习率训练模型
- 论文的实验使用Theano + 单个GPU训练
Others:
Occupancy map pooling(O-LSTM)
As a simplification, we also eperiment with a model which only pools the coordinates of the neighbors(referred to as O-LSTM).
for a person , we modify the definition of the tensor ![]() , as a
, as a ![]() matrix at time t centered at the person's position, and call it the occupancy map
matrix at time t centered at the person's position, and call it the occupancy map ![]() . The positions of all the neighbors are pooled in this map The m,n element of the map is simply given by :
. The positions of all the neighbors are pooled in this map The m,n element of the map is simply given by :
The vectorized occupancy map is used in place of ![]() in last section while learning this simpler model.
in last section while learning this simpler model.
Inference for path prediction
From time Tobs+1 to Tpred, we use the predicted position ![]() from the previous Social-LSTM cell in place of the true coordinates
from the previous Social-LSTM cell in place of the true coordinates ![]() , the predicted positions are also used to replace the actual coordinates while constructing the Social hidden-state tensor
, the predicted positions are also used to replace the actual coordinates while constructing the Social hidden-state tensor ![]() or the occupancy map
or the occupancy map![]() .
.
Implementation details
- use an embedding dimension of 64 for the spatial coordinates before using as input to the LSTM
- set the spatial pooling size N0=32
- 8*8 sum pooling window size without overlaps
- fixed hidden-state dimension of 128 for all the LSTM models.
- using an embedding layer with ReLU on top of the pooled hidden-state features, before using them for calculting the hidden state tensor

- hyper-parameters were chosed on cross-validation on a synthetic dataset
- This synthetic was generated using a simulation that implemented the social forces model, containing trajectories for hundreds of scenes with an average crowd density of 30 per frame.
- learning rate = 0.003 and RMS-prop for training the model
- Trained on a single GPU with Theano implementation
Experiments
As shown in [49], these datasets also cover challenging group behaviours such as couples walking together, groups crossing each other and groups forming and dispersing in some scenes.
-
Human-trajectory datasets
ETH and UCY
-
Report the prediction error with threedifferent metrics
- Average displacement error - The mean square error(MSE) over all estimated points of a trajectory and the true points.
- Final displacement error - The distance between the predicted final destination and the true final distination and the true final destination at the end of the prediction period

- Average non-linear displacement error - This is the MSE at the non-linear regions of a trajectory.
-
Leave-one-out approach
Train and validate this model on 4 sets and test on the remaining set. Repeat this for all the 5 sets.
-
Test
Observe a trajectory for 3.2secs and predict their paths for the next 4.8secs.
At a frame rate of 0.4, this corresponds to observe 8 frames and predicting for the next 12 frames. -
Comparation
- Linear model
- Collision avoidance
- Social force
- Iterative Gaussian Process
- Our vanilla LSTM
- our LSTM with occupancy maps
Vanilla LSTM outperforms this linear basline since it can extrapolate non-linear cuives. However, this simple LSTM is noticeably worse than the Social Force and IGP models which explicitly model human-human interactions.
Social pooling based LSTM and O-LSTM outperfor the heavily engineered Social Force and IGP models in almost all datasets.
THe IGP model which knows the true final destination during testing achieves lower errors in parts of this dataset.
Social-LSTM ouperforms O-LSTM in the more crowed UCY datasets which shows the advantage of pooling the entire hidden state to capture complex interactions in dense crowds.
In particular, the error reduction is more significant in the case of the UCY datasets as compared to ETH. This can be explained by the different crowd densities in the two datasets: UCY contains more crowded regions with a total of 32 K non-linearities as opposed to the more sparsely populated ETH scenes with only 15 K nonlinear regions.
Conclusions
Use one LSTM for each trajectory and share the information between the LSTMs through the introduction of a new Social pooling layer. We refer to the resulting model as the "Social" LSTM.
In addition, human-space interaction can be modeled in our framework by including the local static-scene image as an additional input to the LSTM. This could allow jointly modeling of human-human and human-space interactions in the same framework.


