python 时间序列预测 —— prophet
文章目录
- prophet 安装
- 数据集下载
- prophet 实战
- 导入包
- pandas 读取 csv 数据
- 画个图
- 拆分数据集
- 从日期中拆分特征
- 使用 prophet 训练和预测
- prophet 学到了什么
- 放大图
prophet 安装
prophet 是facebook 开源的一款时间序列预测工具包,直接用 conda 安装 fbprophet 即可
prophet 的官网:https://facebook.github.io/prophet/
prophet 中文意思是“先知”
prophet 的输入一般具有两列:ds和y
ds(datestamp) 列应为 Pandas 可以识别的日期格式,日期应为YYYY-MM-DD,时间戳则应为YYYY-MM-DD HH:MM:SS
y列必须是数值
数据集下载
Metro Interstate Traffic Volume Data Set


prophet 实战
导入包
import numpy as np
import pandas as pd
import matplotlib.pyplot as plt
import seaborn as sns

from sklearn.metrics import mean_squared_error, mean_absolute_error

%matplotlib inline
plt.rcParams['font.sans-serif'] = 'SimHei'  #显示中文
plt.rcParams['axes.unicode_minus'] = False  #显示负号
plt.rcParams['figure.dpi'] = 200
plt.rcParams['text.color'] = 'black'
plt.rcParams['font.size'] = 20
plt.style.use('ggplot')
print(plt.style.available)
# ['bmh', 'classic', 'dark_background', 'fast', 'fivethirtyeight', 'ggplot', 'grayscale', 'seaborn-bright', 'seaborn-colorblind', 'seaborn-dark-palette', 'seaborn-dark', 'seaborn-darkgrid', 'seaborn-deep', 'seaborn-muted', 'seaborn-notebook', 'seaborn-paper', 'seaborn-pastel', 'seaborn-poster', 'seaborn-talk', 'seaborn-ticks', 'seaborn-white', 'seaborn-whitegrid', 'seaborn', 'Solarize_Light2', 'tableau-colorblind10', '_classic_test']
pandas 读取 csv 数据
csv_files = 'Metro_Interstate_Traffic_Volume.csv'
df = pd.read_csv(csv_files)
df.set_index('date_time',inplace=True)
df.index = pd.to_datetime(df.index)
df.head()

略扫一眼表格内容,主要有假期、气温、降雨、降雪、天气类型等因素,因变量是交通流量traffic_volume
df.info()
'''

DatetimeIndex: 48204 entries, 2012-10-02 09:00:00 to 2018-09-30 23:00:00
Data columns (total 8 columns):
holiday                48204 non-null object
temp                   48204 non-null float64
rain_1h                48204 non-null float64
snow_1h                48204 non-null float64
clouds_all             48204 non-null int64
weather_main           48204 non-null object
weather_description    48204 non-null object
traffic_volume         48204 non-null int64
dtypes: float64(3), int64(2), object(3)
memory usage: 3.3+ MB
'''

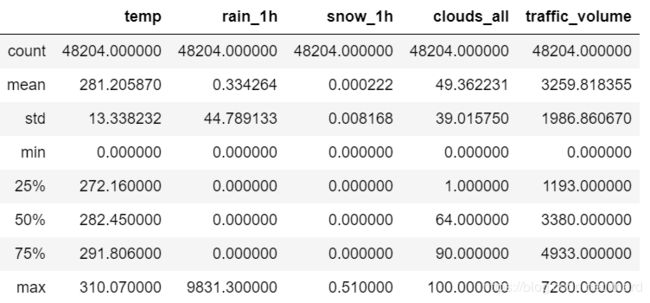
df.describe()
画个图
原来少了一点数据,不过影响不大
traffic = df[['traffic_volume']]
traffic[:].plot(style='--', figsize=(15,5), title='traffic_volume')
plt.show()
拆分数据集
知识点:pandas 中筛选日期
traffic_train = traffic.loc[(traffic.index >='2017-01') & (traffic.index <= '2018-03')].copy()
traffic_test = traffic.loc[traffic.index > '2018-03'].copy()
_ = traffic_test.rename(columns={'traffic_volume': 'TEST SET'})\
    .join(traffic_train.rename(columns={'traffic_volume': 'TRAINING SET'}),how='outer') \
    .plot(figsize=(20,5), title='traffic_volume', style='.')
从日期中拆分特征
虽然 prophet 不需要我们手工提取特征,但我们还是可以自己试试
def create_features(df, label=None):
    """
    Creates time series features from datetime index.
    """
    df = df.copy()
    df['date'] = df.index
    df['hour'] = df['date'].dt.hour
    df['dayofweek'] = df['date'].dt.dayofweek
    df['quarter'] = df['date'].dt.quarter
    df['month'] = df['date'].dt.month
    df['year'] = df['date'].dt.year
    df['dayofyear'] = df['date'].dt.dayofyear
    df['dayofmonth'] = df['date'].dt.day
    df['weekofyear'] = df['date'].dt.weekofyear

    X = df[['hour','dayofweek','quarter','month','year',
           'dayofyear','dayofmonth','weekofyear']]
    if label:
        y = df[label]
        return X, y
    return X

X, y = create_features(traffic, label='traffic_volume')
features_and_target = pd.concat([X, y], axis=1)
features_and_target.head()
sns.pairplot(features_and_target.dropna(),
             hue='hour',
             x_vars=['hour','dayofweek',
                     'dayofmonth','month'],
             y_vars='traffic_volume',
             height=5,
             plot_kws={'alpha':0.15, 'linewidth':0}
            )
plt.suptitle('Traffic Volume by Hour, Day of Week, Day of Month and Month')
plt.show()
上面的 pairplot 可以得出什么信息呢?
首先颜色是按照小时取,所以每种颜色代表一个时辰
后三幅图的竖条上的颜色分布代表不同时间段的流量分布
有意义的信息主要来自散点的分布范围,可以看出:
- 每日的车流量呈现 M 型,意味着上下班高峰
- 一周中周末车要少些
- 一个月中有几天的下限要低于其它日子,这应该是周末
- 一年中有7月和9月的下限要低于其它月份,这应该和天气或者节假日有什么关联
使用 prophet 训练和预测
from fbprophet import Prophet

# Setup and train model and fit
model = Prophet()

model.fit(traffic_train.reset_index().rename(columns={'date_time':'ds','traffic_volume':'y'}))

traffic_test_pred = model.predict(df=traffic_test.reset_index() \
                                   .rename(columns={'date_time':'ds'}))
画出预测结果
f, ax = plt.subplots(1)
f.set_figheight(5)
f.set_figwidth(15)
ax.scatter(traffic_test.index, traffic_test['traffic_volume'], color='r')
fig = model.plot(traffic_test_pred, ax=ax)
- 训练数据太多,使得模型没有把握最近趋势
- 预测范围太大,误差随时间放大
感兴趣的朋友可以自己玩玩
prophet 学到了什么
从下图可以看出:
- 总体趋势:下行
- 每周趋势:工作日流量大、周末流量低
- 每日趋势:早晚上下班高峰,所以每天流量基本呈现 M 型曲线
fig = model.plot_components(traffic_test_pred)
放大图
看看模型对测试集中第一个月的预测情况:
# Plot the forecast with the actuals
f, ax = plt.subplots(1)
f.set_figheight(5)
f.set_figwidth(15)
plt.plot(traffic_test.index, traffic_test['traffic_volume'], color='r')
fig = model.plot(traffic_test_pred, ax=ax)
ax.set_xbound(lower='03-01-2018',
              upper='04-01-2018')
ax.set_ylim(-1000, 8000)
plot = plt.suptitle('Forecast vs Actuals')


