ECharts初试(1)
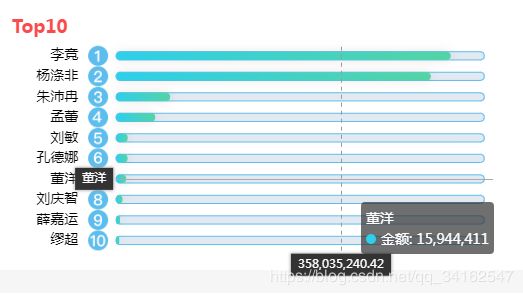
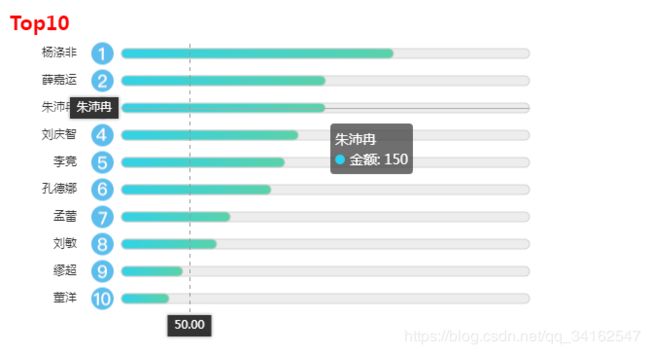
进入公司写的第一个小demo没想到会是用echarts完成一个图表效果。

刚看到图的时候,感觉不难,不过没想到,echarts官方api狠狠地打击我的自信心。
1.vue引入echarts
首先使用 npm install echarts --save
然后在main.js中引用	import echarts from 'echarts'
将其指向VUE实例的原型上	Vue.prototype.$echarts = echarts
//也可以按需引入,不过因为不知道需要配置哪些参数才能实现效果,就直接全部引入
2.创建DOM容器,初始化echarts实例,设置参数
//DOM容器
<div id="echarts" style="width: 600px;height:400px;"> </div>
//图形初始化
let echartsView = this.$echarts.init(document.getElementById('echarts'));
//参数存放的变量
let option = {}
//生成图表
echartsView.setOption(option);
3.参数配置
initEcharts(){
    /*数据处理*/
    this.dataPro(this.echartsData)
    /*序号图标加载*/
    let rankingIcons = {
        'one': require('./../assets/1.png'),
        'two': require('./../assets/2.png'),
        'three': require('./../assets/3.png'),
        'four': require('./../assets/4.png'),
        'five': require('./../assets/5.png'),
        'six': require('./../assets/6.png'),
        'seven': require('./../assets/7.png'),
        'eight': require('./../assets/8.png'),
        'nine': require('./../assets/9.png'),
        'ten': require('./../assets/10.png'),
    };
    /*参数配置*/
    let option = {
        title : {
            text:"Top10",
            top:30,
            textStyle:{
                color: 'red',
                fontSize: 20
            }
        },
        tooltip : {
            trigger: 'axis',
            axisPointer : {            // 坐标轴指示器,坐标轴触发有效
                type : 'cross',
            },
            formatter: function(params) {
                /*自定义提示框*/
                var result = '';
                result += `${params[0].axisValue}`+""
                /*自定义提示框,小点添加*/
                let marker = ``
                result += marker + "金额: " + params[0].value +"";
                return result;
            }
        },
        grid:{
            /*预留容器左边空间*/
            left:120
        },
        xAxis: {
            show:false
        },
        yAxis: {
            type: 'category',
            data: this.nameRanking,
            axisLine:{show:false},     //不展现坐标轴的线
            axisTick: {show: false},   //不展现坐标轴的标点
            axisLabel:{
                formatter: function (value,index) {
                    let mapping = {
                        1:'ten',
                        2:'nine',
                        3:'eight',
                        4:'seven',
                        5:'six',
                        6:'five',
                        7:'four',
                        8:'three',
                        9:'two',
                        10:'one',
                    }
                    /*label返回格式*/
                    return '{value|' + value + '}{' + mapping[index+1] + '|}';
                },
                rich: {
                    value: {
                        height: 23,
                        padding:15,
                        lineHeight: 23,
                    },
                    one: {
                        height: 23,
                        lineHeight: 23,
                        width:23,
                        backgroundColor: {
                            image: rankingIcons.one
                        }
                    },
                    two: {
                        height: 23,
                        width:23,
                        lineHeight: 23,
                        backgroundColor: {
                            image: rankingIcons.two
                        }
                    },
                    three: {
                        height: 23,
                        width:23,
                        lineHeight: 23,
                        backgroundColor: {
                            image: rankingIcons.three
                        }
                    },
                    four: {
                        height: 23,
                        width:23,
                        lineHeight: 23,
                        backgroundColor: {
                            image: rankingIcons.four
                        }
                    },
                    five: {
                        height: 23,
                        width:23,
                        lineHeight: 23,
                        backgroundColor: {
                            image: rankingIcons.five
                        }
                    },
                    six: {
                        height: 23,
                        width:23,
                        lineHeight: 23,
                        backgroundColor: {
                            image: rankingIcons.six
                        }
                    },
                    seven: {
                        height: 23,
                        width:23,
                        lineHeight: 23,
                        backgroundColor: {
                            image: rankingIcons.seven
                        }
                    },
                    eight: {
                        height: 23,
                        width:23,
                        lineHeight: 23,
                        backgroundColor: {
                            image: rankingIcons.eight
                        }
                    },
                    nine: {
                        height: 23,
                        width:23,
                        lineHeight: 23,
                        backgroundColor: {
                            image: rankingIcons.nine
                        }
                    },
                    ten: {
                        height: 23,
                        width:23,
                        lineHeight: 23,
                        backgroundColor: {
                            image: rankingIcons.ten
                        }
                    }
                }
            },
        },
        series: [{
            data: this.valRanking,
            type: 'bar',
            barWidth:10,
            itemStyle:{
                /*正常时的样式*/
                normal: {
                    barBorderRadius:5,
                    borderWidth:1,
                    borderColor:'#ccc',
                    /*渐变色*/
                    color: new this.$echarts.graphic.LinearGradient(0, 0, 1, 0, [{
                        offset: 0,
                        color: "rgb(50,210,230)" // 0% 处的颜色
                    }, {
                        offset: 1,
                        color: "rgb(90,210,170)" // 100% 处的颜色
                    }], false)
                }
            },
            z:5
        },
            /*作为对比的背景*/
            {
            data: [300, 300, 300, 300, 300, 300, 300, 300,300,300],
            type: 'bar',
                /*两个Bar重合*/
            barGap: '-100%',
                /*取消各种事件的触发*/
            silent: true,
            barWidth:10,
            itemStyle:{
                /*正常时的样式*/
                normal: {
                    borderWidth:1,
                    borderColor:'#ccc',
                    color:'rgb(233,233,233)',
                    opacity:0.8,
                    barBorderRadius:5,
                },
                /*hover时的样式*/
                emphasis:{
                    borderWidth:1,
                    borderColor:'#ccc',
                    color:'rgb(233,233,233)',
                    opacity:0.8,
                    barBorderRadius:5,
                }
            },
            z:1
        }]
    };
},
效果基本实现,由于没有具体的颜色值和宽高,基本都是目测的,长得像就行了。
关键点
- 提示框
提示框主要是需要重写效果,因为默认的效果中文字不是居右显示,并且会多一个底层(无填充部分的框)作为对比的数据。重写tooltip样式会缺失那个颜色的小点。需要用html文本自定义添加。颜色为参数的color属性,可以直接用marker。 - 序号图标
序号图标也需要重写坐标轴axisLabel方法,主要是formatter中返回的格式
{rich中样式名 | 需要使用该样式的内容} - 颜色渐变
最坑的就是颜色渐变,echarts官方api根本没有更新这个方法,辛辛苦苦找得怀疑人生。
重写series中itemStyle
/渐变色/
color: new this.$echarts.graphic.LinearGradient(0, 0, 1, 0, [{offset: 0,color: “rgb(50,210,230)” // 0% 处的颜色 },
{offset: 1,color: “rgb(90,210,170)” // 100% 处的颜色 }], false)
graphic.LinearGradient可以设置渐变色。第一个参数为渐变方向。分别为右/下/左/上
第二个就是渐变色的设置了。
