Latex学习笔记 (Ex1) 绘制数学图表
使用LaTeX绘制图片
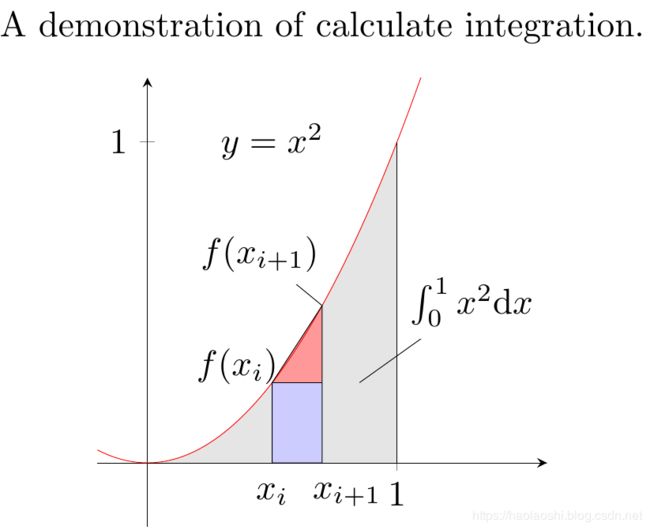
在上篇文章 根据几何定义使用计算机编程求定积分的值 中,引用了下面一张图,这张图是使用 TikZ 绘制的,为方便阅读,所有的 LaTeX \LaTeX LATEX 源代码也一半放出。

\documentclass[9pt]{article}
\usepackage{pgfplots}
\pgfplotsset{compat=1.16}

\begin{document}
\begin{tikzpicture}[scale=2]
\begin{axis}[
	title={A demonstration of calculate integration.},
	axis x line = middle,
	axis y line = middle,
	xmin=-0.2, xmax=1.6,
	ymin=-0.2, ymax=1.2,
	xtick={1},
	ytick={0, 1},
	% xstep=1,ystep=1,
	very thin,
	width=6cm,
	height=6cm,
	trig format plots=rad,
	variable=x]

\fill[gray!20, domain=0:1, variable=\x]  (0, 0)  -- plot ({\x}, {\x*\x})  -- (1, 1)  -- (1,0) -- cycle;
\fill[blue!20!white] (0.5,0) rectangle (0.7,0.25);
\fill[red!40!white] (0.5, 0.25) -- (0.7, 0.25) -- (0.7, 0.49) -- cycle;

\addplot[red,very thin,domain=-1:3,samples=200] (x, x^2);
\draw[very thin] (0,0) -- (7,0);
\draw[very thin] (1,0) -- (1,1);
\draw[very thin] (0.5,0.25) -- (0.7,0.25);
\draw[very thin] (0.5,0) -- (0.7,0) -- (0.7,0.49) -- (0.5, 0.25) -- cycle;
\draw (0.5,1) node {$y=x^2$};
\draw (0.5,-0.1) node {$x_i$};
\draw (0.36,0.3) node {$f(x_i)$};
\draw (0.8,-0.1) node {$x_{i+1}$};
\draw (0.7,0.49) -- (0.45,0.65) node[fill=white] {$f(x_{i+1})$};
\draw (0.85, 0.25) -- (1.3, 0.5) node[fill=white] {$\int_0^1 x^2 \mathrm{d}x$};
\end{axis}
\end{tikzpicture}
\end{document}